
Download
REVIEW
Circular economy in the brewing chain
Alessio Cimini, Mauro Moresi*
Department for Innovation in the Biological, Agrofood and Forestry Systems, University of Tuscia, Via S.C. de Lellis, Viterbo, Italy
Abstract
The main aim of this review was to check for the applicability of the concept of circular economy to brewing chain. By analyzing the beer brewing process, it was possible to identify the main brewery wastes formed and packaging materials used as well as their range of composition and yields. In order to reduce the contribution of packaging material to the carbon footprint of beer, it would be necessary to replace one-way containers used nowadays with lighter, reusable, or recycled ones. Even if the contribution of beer consumption phase was taken into account, there was no definitive solution about the less environmentally impacting beer packaging format. The direct management of polyethylene terephthalate (PET) packaging for liquid foodstuffs could make available 100% recycled PET flakes to be reconverted into food-grade bottles with minimum downcycling to other non-food usage. The countless potential uses of brewery wastes in nutritional and biotechnological fields were tested in laboratory by disregarding any cost–benefit or market analysis. This was mainly because the estimated market price of dried brewer’s spent grain (BSG) resulted to be about 450% higher than that of conventional lignocellulose residues. All the alternative uses hailed in the literature appeared to be more useful for publishing articles than for defining any economically feasible reusing procedure for all brewery wastes. Owing to their high moisture content, such wastes are so perishable as to prevent their safe usage in the human food chain. Currently, their use as-is in animal feeding is the disposal method not only economically feasible but also able to reduce the greenhouse gas load of beer packed in glass bottles (GB) by about one-third of that associated with packaging materials. Not by chance, it is practiced by most industrial and craft breweries.
Key words: beer chain, beer packaging formats, brewer’s spent grain, brewer’s spent yeast, carbon footprint, environmental impact, hot trub, post-consumer packaging waste, disposal methods, spent hops
*Corresponding Author: Mauro Moresi, Department for Innovation in the Biological, Agrofood and Forestry Systems, University of Tuscia, Via S.C. de Lellis, 01100 Viterbo, Italy. Email: mmoresi@unitus.it
Received: 21 September 2021; Accepted: 3 December 2021; Published: 14 December 2021
© 2021 Codon Publications
This is an Open Access article distributed under the terms of the Creative Commons Attribution-NonCommercial-ShareAlike 4.0 International (CC BY-NC-SA 4.0). License (http://creativecommons.org/licenses/by-nc-sa/4.0/)
Introduction
Beer is a globally consumed alcoholic beverage (about 1.91 billion hectoliter (hL) in 2019; Statista, 2021), with its overall market in 2020 amounting to US$623.2 billion (IMARC Group, 2021). In Italy, the overall production of beer in 2020 was about 15.8 million hL, about 71% of which being produced by five major players, such as Heineken Italia with a share of 33.3%, Birra Peroni with 18.3%, Anheuser-Busch InBev with 8.6%, Birra Castello with 5.8%, and Carlsberg Italia with 5.3% share (Associazione dei Birrai e dei Maltatori [Assobirra], 2020). In 2020, 756 craft breweries (i.e., 624 micro-breweries and 132 brewpubs) produced 361,000 hL of beer with an average specific gravity of 14° Plato, this being equal to ∼3.1% of the Italian beer production (Assobirra, 2020). In Italy, the per capita consumption of beer in 2019 was about 35.2 L. Standard lager is the most popular beer type, representing 84.2% of the overall beer consumption, followed by specialty beers (14.5%) and low or nonalcoholic ones (1.3%). Owing to decrease in beer consumption outside the home from 45.5% in 1999 to 36.1% in 2019, and conversely the increase in off-sales, the prevailing beer packaging format is dominated by glass bottles (GB; 80.8%), followed by stainless steel kegs (SSK; 11.7%), and finally aluminum cans (AC; 7.5%) (Assobirra, 2020). Most consumers purchase beer in glass bottles (73.0% and 7.8% of which being produced from nonreturnable and returnable GBs, respectively) or aluminum cans, while beer packaged in stainless steel kegs is chiefly for commercial use.
Owing to predictable increase in the global demand of food, this currently representing from 22% to 37% of the world anthropogenic greenhouse gas (GHG) emissions (Rogissart et al., 2019), the economic growth of the food and beverage industry is expected to be greatly hampered by climate-related risks to food security, and water and energy supply (Intergovernmental Panel on Climate Change [IPCC], 2014). As reported by the Beverage Industry Environmental Roundtable (BIER, 2012), the beverage sector has not only started to reduce its impact on the global climate but also to rethink its business models, products, and processes according to the principles of circular economy (Bocconi University et al., 2021).
Over the last 20 years, several business-to-business or business-to-consumer studies (Amienyo and Azapagic, 2016; BIER, 2012; Cimini and Moresi, 2016; Environmental Product Declaration® [EPD], 2011a, 2011b, 2014a, 2014b; Hospido et al., 2005; Koroneos et al., 2005; Muñoz et al., 2012; Narayanaswamy et al., 2005; Shin and Searcy, 2018; Talve, 2001; Williams and Mekonen, 2014) have been conducted to evaluate the environmental impact of beer as packed in different formats, as summarized by Cimini and Moresi (2018c).
Glass bottle or aluminum-can manufacturing and barley cultivation represented the main hot spots of beer life cycle (Amienyo and Azapagic, 2016; Cimini and Moresi, 2016). Only when using reusable steel kegs, barley production was the most impacting step, followed by brewing and distribution (Cimini and Moresi, 2016). As estimated by Mata and Costa (2001) and confirmed by Amienyo and Azapagic (2016), the contribution of returnable glass bottles to the carbon footprint (CF), acidification, photochemical ozone creation, human toxicity, and energy and raw material consumption was smaller than that of nonreturnable bottles after the second reuse, while that to eutrophication, ozone depletion, solid waste, water and auxiliary material consumption was larger even after several reuses.
Holland (2021) described a few means to address the most environmentally altering effects of beer production and distribution (e.g., GHG emissions, and disposal of wastewaters and post-consumer packaging wastes) using circular thinking approaches. The author cited either quite exiguous initiatives (e.g., 100% biodegradable, edible six-pack ring pulling on cans prepared from barley and wheat ribbons, adopted by Saltwater brewery to replace the conventional plastic ones) or more significant ones (e.g., use of waste bread instead of malted barley by Toast Ale in Belgium, wind turbines and solar panels as sources of nonrenewable energy by Heineken in Holland and Italy).
The main aim of this review was to further verify the applicability of circular economy concepts to the brewing chain. To this end, the main steps of the beer brewing process were outlined to point out main brewery wastes in terms of composition and yield factors. Then the real and effective reuses of packaging and biotic wastes were critically reviewed based on their techno-economic feasibility.
Inventory Analysis of the Brewing Process
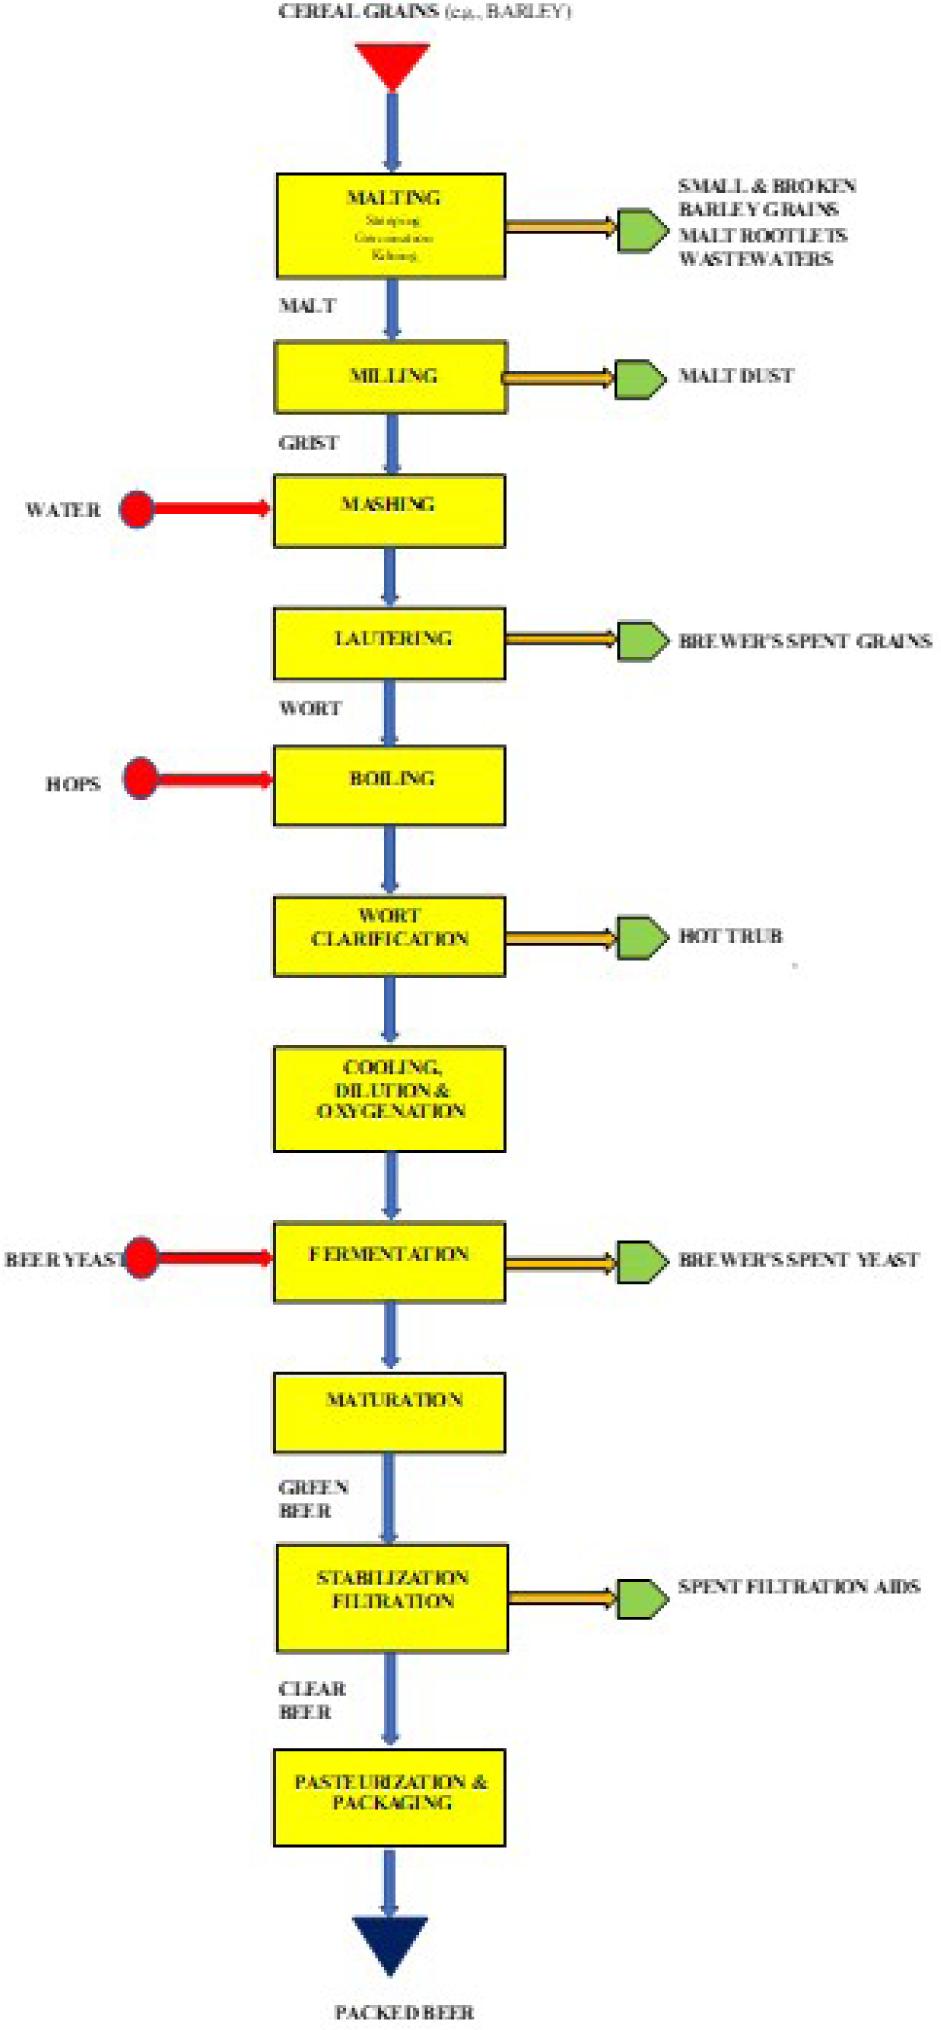
Figure 1 shows block diagram of the beer production process from its basic raw material, that is, barley. The average chemical composition of barley is provided in Table 1. It differs with barley variety and environmental conditions. The starch, β-glucan, protein, fat, and ash contents vary in the ranges of 65–68%, 4–9%, 10–17%, 2–3%, and 1.5–2.5% (dry basis), respectively (Alijošius et al., 2016; Gupta et al., 2010). An ideal protein content of barley destined to brewing ranges from 9.5% to 12.8% (dry basis), while higher protein contents are suitable for producing malt for distilling (Grains Research & Development Corporation (GRDC), 2018; Paynter, 1996).
Figure 1. Schematic of the beer production process and its main brewery byproducts.
Table 1. Range of chemical composition of barley and its main brewery byproducts, namely, malt barley rootlets (MBR), brewer’s spent grain (BSG), spent hops/hot trub (HT), and brewer’s spent yeast (BSY).
| Component | Barley | MBR | BSG | HT | BSY | Unit |
|---|---|---|---|---|---|---|
| Moisture | 12.8 | 8.2–12.9 | 75–90 | 80–90 | 74–86 | g/100 g |
| Carbohydrates | 0.624 | 0.51–0.60 | 0.45–0.61 | 0.20 | 0.4 | g/g DM |
| Protein | 0.113 | 0.203–0.387 | 0.142–0.300 | 0.40–0.70 | 0.15–0.49 | g/g DM |
| Fat | 0.019 | 0.017–0.044 | 0.06–0.13 | 0.045 | 0.04–0.10 | g/g DM |
| Ash | 0.03 | 0.028–0.087 | 0.011–0.050 | 0.06–0.25 | 0.02–0.085 | g/g DM |
| Total fiber | 0.215 | 0.43 | 0.44–0.84 | 0.23–0.26 | 0.25–0.53 | g/g DM |
| Specific amount | 0.03–0.05 kg kg–1 malt | 14–19 | 0.2–0.4 | 2–4 | kg/hL beer | |
| References | Alijošius et al., 2016 | Neylon et al., 2020 | Jackowski et al., 2020; Karlović et al., 2020; Rachwał et al., 2020 | |||
DM: dry matter; hL: hectoliter.
Malting is the first step of the brewing process. It consists of three different unit operations: steeping, germination, and drying. During steeping, barley seeds are soaked in water until imbibed with sufficient water to start their sprouting process. The germination phase allows a series of amylases, proteases, and other endogenous hydrolytic enzymes to be produced and/or activated. Final drying stops further growth of germs, reduces water activity, and thus yields a shelf-stable product with active enzymes (i.e., barley malt). The average malt-to-barley ratio ranges from 0.75 (Climate Conservancy, 2008) to 0.79 (Food and Agriculture Organization [FAO], 2009). The main byproduct of malting (i.e., barley rootlets, also known as malt culms, coombes, or sprouts) represents 3–5% (w/w) of the malt produced. It may contain other wastes, such as malt dust, small and broken barley grains, barley dust, acrospires, and husk fractions. As depicted by Neylon et al. (2020), its range of composition is provided in Table 1.
Malt milling is the second step. It allows the malt to be separated from its chaff, coarsely ground, and sifted into three fractions, namely, the husk, grits, and flour. The smaller the particle size, the greater the extract (and the smaller the filtration rate). Husk is the outer layer of barley kernel undergoing grinding and must be kept intact as possible to allow the formation of porous filter beds and thus minimize filtration time. Larger particles can be reground, thus yielding other byproducts, such as hull fractions and fine malt powders (Crescenzi, 1987; Stubits et al., 1986).
Mashing is the third step. The grit is suspended into hot water to allow starch sugars, proteins, and tannins to be dissolved in the so-called malt extract. In European breweries, malted barley consumption ranges from 15 kg/hL to 18 kg/hL of beer produced (United Nations Environment Program [UNEP], 1996), while in Italian industrial breweries, 1 hL of beer at a specific gravity of 12°Plato (equivalent to an ethanol content of about 5% v/v) needs approximately 12-kg malt and 4-kg unmalted cereals, such as corn grits (Assobirra, 2020). The specific consumption of malted barley appears to be inversely proportional to the brewery size. It is as high as 28–32 kg hL-1 in the case of craft breweries with an annual capacity of about 1,000 hL of beer (Beloborodko et al., 2014; Sturm et al., 2012) and as low as 18–20 kg hL-1 in the case of industrial breweries with an overall capacity of more than 1 million hL/yr (Cimini and Moresi, 2018c). Referring to the overall volume of abstracted water during malting, brewing, and clearing steps, the specific water consumption was about 4.2 L per liter of beer produced in Italian breweries (Assobirra, 2020), and it can range from 3.5 to 10 L per liter of beer (Olajire, 2020) or to as high as 19 L (Sturm et al., 2013) or 34 L of specific water per liter of beer produced (Pauli, 1997) in old micro-breweries.
Lautering is the fourth step of the brewing process. It is carried out in the lauter tun to fractionate wort from the so-called wet brewer’s spent grains (BSGs), these being the chief byproduct of this process with an average amount of 16 kg hL-1 of beer produced (Assobirra, 2020). Table 1 provides their range of composition and amount, as described by several authors along with the International Finance Corporation (IFC, 2007) and UNEP (1996).
Wort boiling or hopping is the fifth step, which comprises the addition of different types and amounts of hops to boiling wort according to the style of beer to be produced. As boiling proceeds, the malt enzymatic pool is deactivated, and as water is evaporated, malt proteins and hop tannins tend to precipitate at the bottom of the concentrated hopped wort. The average amount of hop pellets used in the Italian breweries is around 260 g hL-1 (Assobirra, 2020), even if it is quite lower (∼92 g hL-1) in the case of lager (Cimini and Moresi, 2016).
Wort clarification is the sixth step. By feeding tangentially the hopped wort in a whirlpool separator, the resulting moderate centrifugal action allows the hot trub and spent hops to be separated from clear wort. Table 1 provides the range of composition of such a proteinaceous residue, as described by Rachwał et al. (2020). Moreover, its overall quantity varies from 0.2 to 0.4 kg hL-1 depending on the amount and type of protein present in the used barley, which, in turn, is dependent on crop location, seasonal factors, and genetics (Barchet, 2019).
Wort cooling is the seventh step. It allows the clear wort to be cooled to a temperature depending on the yeast used and the style of beer being produced. It usually ranges from 16 to 20°C and from 10 to 13°C in the case of ale and lager production, respectively. If the wort coming out of the whirlpool separator has a higher strength than that required for fermentation, it is diluted with water to obtain its correct specific gravity. Moreover, to allow yeast replication in the early stages of fermentation and guarantee adequate fermentation, an appropriate level (7–18 mg/L) of dissolved oxygen in the wort is provided by aerating the wort on hot or cold side of wort heat exchanger. The oxygen consumption was 1.43 g/hL of lager produced (Cimini and Moresi, 2016).
Wort fermentation is the eighth step of the brewing process by which fermentable sugars are converted into ethanol, carbon dioxide, and several other metabolic byproducts by brewer’s yeast. These have a significant effect on the taste, aroma, and other characteristic properties of the style of beer under production. On stoichiometric basis, 1-g maltose must be theoretically converted into 0.538-g ethanol. The average inoculation rate in Italian breweries is 0.8 kg hL-1 of beer (Assobirra, 2020). Such a phase is usually accomplished in cylindroconical fermenters. Their angle at the bottom of tanks allows the yeast to settle in the bottom of conic vessel at the end of primary fermentation before being collected without exposure to air. Thus, a rough beer relatively free of yeast could be discharged. After harvesting, the yeast is stored with its own liquid under gentle agitation at 0°C for next fermentation. In this manner, brewer’s yeast could be used sequentially for four to six times (Karlović et al., 2020). The range of composition of brewer’s surplus yeast (BSY) is provided in Table 1, as described by different studies. Its amount ranges from 2 to 4 kg hL-1 of the beer produced (IFC, 2007; UNEP, 1996); its mean value in Italy was 1.6 kg hL-1 by assuming a 10% dry matter (DM) content (Assobirra, 2020).
Maturation is the ninth step of the process. The freshly brewed liquid undergoes the second fermentation, providing beer its characteristic color in as long as 3 weeks to 3 months depending on the type of beer being produced.
Beer clarification and stabilization is the tenth step. Proteins, yeast particles, and resins from the hop left in the beer after the first and second fermentation phases are generally removed by filtration in the presence of filter aids (i.e., kieselguhr slurry or diatomaceous earth [DE]). Then, to avoid permanent or chill haze (Siebert et al., 1996), haze active polyphenols are removed by using polyvinylpolypyrrolidone (PVPP), while haze active proteins are removed by means of silica hydrogel or tannic acid. In European breweries, the specific consumption of DE ranges from 80 to 570 g/hL of beer (IFC, 2007; UNEP, 1996), while that of non-regenerable PVPP ranges from 20 to 40 g (Gopal and Rehmanji, 2000) and that of regenerable PVPP by around 0.1 g hL-1 (Cimini and Moresi, 2015).
Filling is the final step of the beer brewing process. If the finished beer is to be kept in glass bottles, it is first bottled and then batch-pasteurized to prolong its shelf life. When using cans or kegs, clear beer undergoes flash-pasteurization and is packed aseptically. By referring to main packaging formats in use (Cimini and Moresi, 2016, 2018c), 1 hL of lager (weighing ∼100.5 kg) would require as much as 43.9 or 56.1 kg of 66-cL or 33-cL amber glass bottles, just 4.4 kg of 66-cL polyethylene terephthalate (PET) bottles, 4.9 kg of 33-cL aluminum cans, and as much as 32.0 kg of 30-L stainless steel kegs (Table 2). This clearly the great contribution of packaging materials per unit volume of beer delivered, especially in the case of glass bottles and stainless steel kegs.
Table 2. Mass of the packaging materials used to pack 1 hL of beer in different formats (66-cL and 33-cL amber glass bottles [GB]; 66-cL PET bottles [PB]; 33-cL aluminum cans [AC]; 30-L stainless steel kegs [SSK]), as described by Cimini and Moresi (2016, 2018c).
| Packaging format Packaging materials |
66-cL GB | 33-cL GB | 66-cL PB | 33-cL AC | 30-L SSK | Unit |
|---|---|---|---|---|---|---|
| Glass | 43.9 | 56.1 | 0.0 | 0.0 | 0.0 | kg/hL |
| Paper & cardboard | 3.0 | 3.4 | 3.0 | 1.2 | 0.0 | kg/hL |
| Plastic | 0.1 | 0.1 | 4.4 | 0.3 | 0.0 | kg/hL |
| Steel | 0.3 | 0.6 | 0.0 | 0.0 | 32.0 | kg/hL |
| Aluminum | 0.0 | 0.0 | 0.0 | 4.9 | 0.0 | kg/hL |
| Wood | 2.8 | 3.2 | 3.0 | 1.9 | 2.5 | kg/hL |
| Adhesive materials | 0.2 | 0.2 | 0.2 | 0.2 | 0.0 | kg/hL |
| Overall | 50.3 | 63.6 | 10.6 | 8.5 | 34.5 | kg/hL |
For further details of the brewing process, refer to Eßlinger (2009).
Application of the Concept of Circular Economy to the Beer Brewing Process
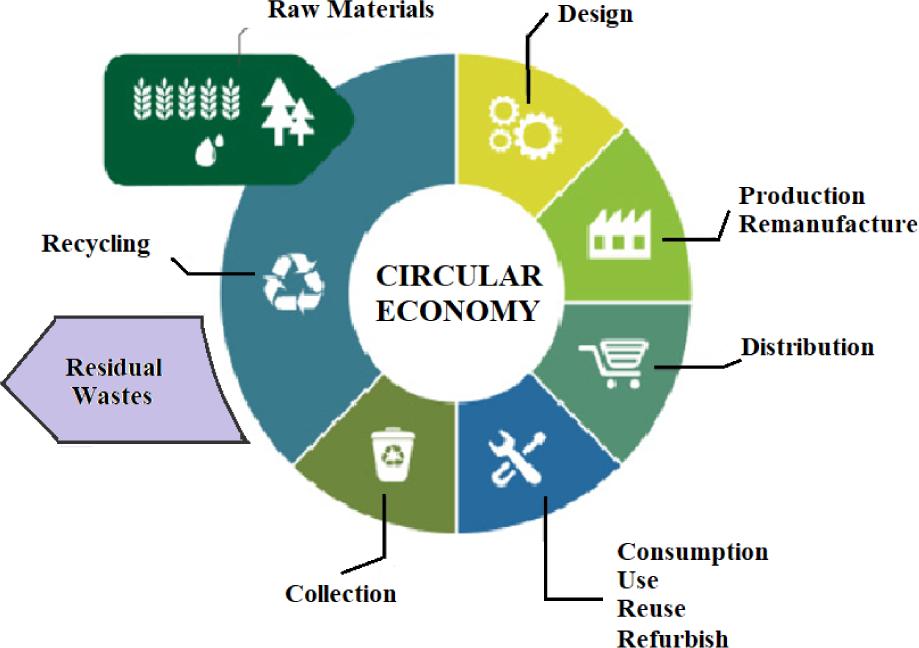
The linear economy model reflects man-made ecosystems for food production, which requires not only a continuous supply of energy and mass from outside, as nutrients are not recycled at the crop cultivation site, but also the treatment of wastes. On the contrary, the so-called circular economy model refers to natural ecosystems, which are capable of self-regeneration. As sketched in Figure 2, its priority area is aimed at eliminating waste and pollution, keeping products and materials in use, and regenerating natural systems (Bocconi University et al., 2021).
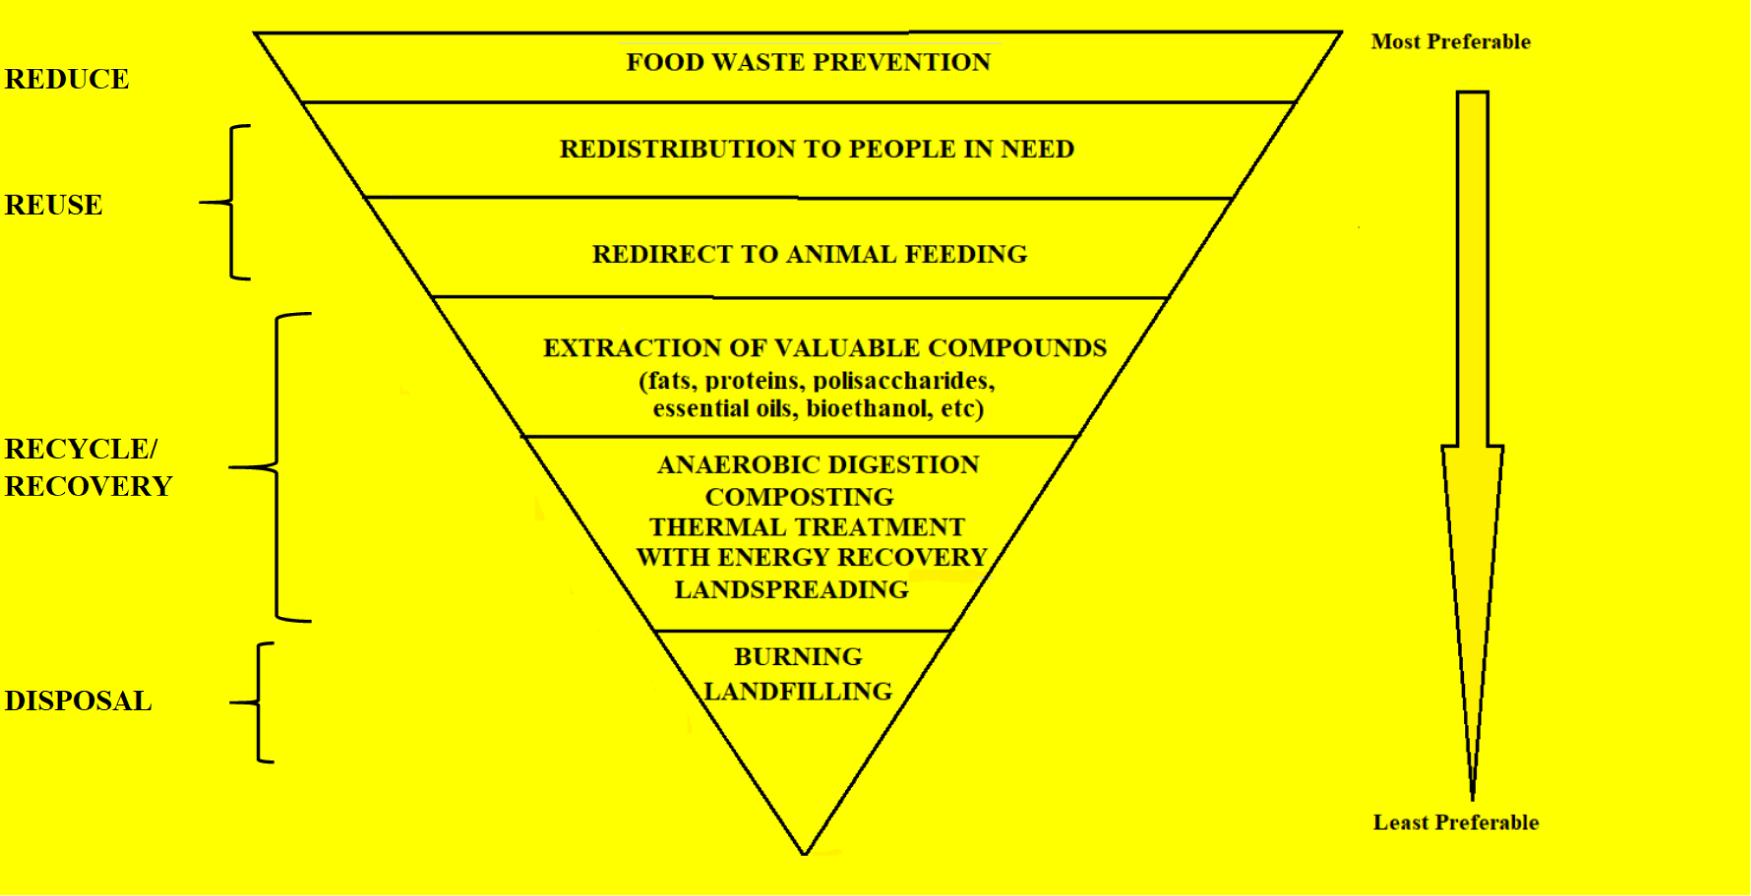
According to the waste hierarchy set out in Article 4 of the revised waste framework (Directive 2008/98/EC; European Union [EU], 2008), any waste must be handled in a manner that does not have a negative impact on the environment or human health. First, its formation must be prevented using, for instance, less material in design and manufacture. When the waste has been formed, its entire apparatus or replacement parts must be refurnished to be reused, recycled, submitted to other recovery options, and, as the least preferred option, disposed of via landfilling or incineration with no recovery of energy. Such a waste hierarchy was further detailed by Garcia-Garcia et al. (2015), as shown in Figure 3.
Figure 2. Schematic of the circular economy concept.
Figure 3. Food waste hierarchy used to select different waste management alternatives according to their environmental preference, as reworked by Garcia-Garcia et al. (2015).
Prevention of wastage of food is the alternative preferred mostly, followed by food redistribution to people in need, and then to animals, unless it is composed of products of animal origin or is a catering waste. If such options are not applied, then food waste can be regarded as a source from which several valuable products (e.g., fats, proteins, polysaccharides, polyphenols, etc.) could be extracted selectively. Then it may be submitted for anaerobic digestion, composting, thermal valorization, or spread for land fertilization or improvement. Waste burning with no energy recovery and landfilling are regarded as the least preferable management options to use (Garcia-Garcia et al., 2015).
By referring to the brewing chain, application of the concept of circular economy essentially refers to the following two aspects:
-
The reuse of abiotic materials, such as packaging materials, and spent kieselguhr, their overall weight being mainly made of glass bottles, which are, for instance, used to pack about 81% of the entire beer produced in Italy (Assobirra, 2020).
-
The reuse of biotic materials, namely, the main byproducts of the beer brewing process.
End of Life of Abiotic Materials
Packaging materials
All abiotic materials arising from beer packaging and pallet management at distribution centers (DC) generally undergo separate waste collection to allow recycling of glass, plastic, aluminum, steel, paper, or wood for their recycling.
The discarded fraction of packaging components varies from 0.4% in the case of glass bottles to 3.5% in the case of the stretch wrap film, as detected in an industrial brewery (Cimini and Moresi, 2016).
The disposal scenarios of all packaging wastes, resulting from beer processing and post-consumption, generally coincide with those of municipal solid waste. For instance, Table 3 refers to the overall Italian management scenarios in 2019 (Mariotta and Tuscano, 2020). It is noted that the minimum objective (65%) of recycling, in terms of weight, for all packaging wastes, to be met by 31 December 2025 according to Directive 2018/852/EU (EU, 2018), has been achieved nationwide since 2019, although there are differences in some districts of South Italy and plastic recycling rate is still lower than the target value of 50% (Mariotta and Tuscano, 2020).
Table 3. Overall Italian waste management scenarios for packaging wastes in 2019, as described by Mariotta and Tuscano (2020).
| Waste management scenarios | Landfill | Recycling | Incineration |
|---|---|---|---|
| Waste | (%) | (%) | (%) |
| Glass | 22.7 | 77.3 | 0 |
| Paper and cardboard | 11.6 | 80.8 | 7.6 |
| Iron | 17.8 | 82.2 | 0 |
| Plastic | 10.1 | 45.5 | 44.4 |
| Aluminum | 23.9 | 70.0 | 6.1 |
| Wood | 34.8 | 63.1 | 2.1 |
| Overall | 19.2 | 70.0 | 10.8 |
In order to measure the environmental impact of main packaging materials used to pack beer, we referred to the only effect of beer on climate change, since this impact category was found to be highly correlated to the fossil cumulative energy demand, which, in turn, affected several other categories, such as acidification, eutrophication, and photochemical ozone formation (Huijbregts et al., 2006) as well as the nitrogen and phosphorous emissions resulting from synthetically fertilized soils used for agri-food cultivation (Huijbregts et al., 2010). Under these circumstances, by accounting for the overall weight factors attributed to the effects of such impact categories in the product environmental footprint methodology, the contribution of climate change and its related impact categories would represent 50% or 53% of the overall weighted endpoint score when including or excluding the toxicity-related impact categories (Sala et al., 2018). Owing to the diverse contribution of packaging materials and transportation, the beer packaging format exerted a diverse influence on the GHGs emitted to produce and distribute industrial beer from the factory gate to the distribution centers, as assessed previously (Cimini and Moresi, 2016). By disregarding the GHG credits derived from the use of brewery wastes as cattle feed, these being about 12 kg of carbon dioxide equivalent (CO2e) per hL of beer (Cimini and Moresi, 2016), the business-to-business product carbon footprint (CF) of beer was found to be of the order of 69 or 78 kg CO2e hL-1, or 81 or 37 kg CO2e hL-1 if the beer was packed in 66- or 33-cL glass bottles, or 33-cL aluminum cans or 30-L stainless steel kegs, respectively (Table 4). Since kegs, on average, are used for 72 times, the contribution of packaging materials was just 5% of the overall GHG burden, while that of glass bottles and aluminum cans was from 5 to 6 times higher, respectively. On the contrary, the contribution of transportation increased to 25% in the case of kegs in consequence of their tare (9.6 kg), while it was, respectively, 14% or 10% if glass bottles or aluminum cans are used (Table 4).
Table 4. Contribution of different life cycle phases to the GHG emitted to produce and distribute 1 hL of lager as packed in containers of different volumes and masses, as described by Cimini and Moresi (2016).
| Beer primary packaging type | GB | AC | SSK | |
|---|---|---|---|---|
| Volume (L)/Mass (kg) | 0.66/0.290 | 0.33/0.185 | 0.33/00123 | 30.00/9.6 |
| Life cycle phases | GHG emissions (kg CO2e hL-1) | |||
| Raw materials & processing aids | 16.88 | 16.88 | 16.88 | 16.88 |
| Brewing processing & packaging | 8.41 | 8.4 | 8.33 | 8.41 |
| Packaging materials | 33.33 | 42.19 | 47.55 | 1.86 |
| Transportation | 9.71 | 10.67 | 8.09 | 9.26 |
| Waste disposal | 0.58 | 0.58 | 0.57 | 0.61 |
| Beer production and distribution | 68.91 | 78.71 | 81.42 | 37.02 |
GHG: greenhouse gas; GB: glass bottles; AC: aluminum cans; SSK: stainless steel kegs.
Thus, to reduce the contribution of packaging materials to the carbon footprint of beer, it would be necessary to resort to:
-
lighter bottles or kegs,
-
bottles, including greater percentage of recycled materials,
-
containers reusable as many times as possible.
In the case of beer packed in glass bottles, 10% decrease in the mass of glass bottles would reduce the carbon footprint of beer by 2.4–2.6% (Cimini and Moresi, 2016) to a maximum of 5% (Amienyo and Azapagic, 2016) due to lower impact for their manufacture and transportation. Approximately 70% less GHG emissions were estimated when the Tuborg® beer was packed in 20-L plastic drums weighing 290 g each (EPD, 2011a).
Further savings are expected by the replacement of glass bottles or aluminum cans with nanoclay-enriched polyethylene terephthalate (PET) bottles, their empty bottle weight being ∼26 g, and their carbon footprint near to one-third of that (∼9 kg CO2e kg-1) of 50% recycled aluminum cans (Cimini and Moresi, 2016, 2018c). As provided in Table 5, when beer was packed in PET bottles instead of glass bottles, the GHG contribution of packaging materials reduced by about 29%, while that of transportation by 25–57%, as the brewery capacity was reduced from 2 million to 500 hL per year.
Table 5. Contribution of main beer life cycle phases to cradle-to-grave (C2G) carbon footprint (CFC2G) of 1-hL beer packed in 66-cL glass or PET bottles by breweries of different annual capacity, as described by Cimini and Moresi (2018c).
| Brewery capacity (hL/year) | 2 × 10⁶ | 5 × 10⁵ | 5 × 10⁴ | 5 × 10² | ||||
|---|---|---|---|---|---|---|---|---|
| Beer primary packaging type | GB | PB | GB | PB | GB | PB | GB | PB |
| Life cycle phases | GHG emissions (kg CO2e hL-1) | |||||||
| Raw materials and processing aids | 23.9 | 27.0 | 30.6 | 41.7 | ||||
| Brewing and packaging processing | 12.1 | 13.7 | 16.8 | 49.5 | ||||
| Packaging materials | 34.0 | 24.0 | 34.3 | 24.3 | 33.6 | 23.7 | 33.6 | 23.7 |
| Waste and effluent disposal | 1.9 | 2.0 | 3.1 | 3.1 | 0.6 | 0.6 | 0.6 | 0.6 |
| CO2e credits from byproduct use as feed | –2.2 | –2.2 | –2.5 | –2.5 | –2.9 | –2.9 | –3.8 | –3.8 |
| Transportation to DCs | 19.8 | 15.1 | 20.5 | 13.5 | 22.5 | 12.6 | 15.6 | 5.9 |
| Transportation from DCs to retailers | 9.7 | 7.1 | 7.3 | 5.3 | 2.4 | 1.8 | 2.4 | 1.8 |
| Retailer refrigeration | 0.3 | 0.3 | 0.3 | 0.3 | ||||
| Consumer phase | 18.1 | 18.1 | 18.1 | 18.1 | ||||
| Post-consumer waste disposal | –11.0 | 4.6 | –11.0 | 4.6 | –11.0 | 4.6 | –11.0 | 4.6 |
| CFC2G | 106.7 | 104.9 | 110.8 | 107.5 | 111.0 | 106.1 | 147.1 | 142.3 |
GHG: Greenhouse gases; DCs: distribution center; GB: glass bottles; PB: PET bottles.
Nevertheless, as expected, the use of such a lighter packaging material was not so effective, since the cradle-to-grave GHG burden of beer decreased by as low as ∼1.7–3.3%. This was a direct consequence of different average recycling rates of glass (70.3%) and plastic (37.9%) wastes registered in Italy in 2014 (Cimini and Moresi, 2018c). In fact, the GHG load of brewery and post-consumer packaging waste disposal was negative in the case of glass bottles (–11 kg CO2e hL-1) but positive in the case of PET bottles (+4.6 kg CO2e hL-1). By referring to the current higher recycling rates of such packaging wastes (Table 3), the glass and plastic recycling rates, respectively, increased by circa +10% and +20% with respect to the aforementioned basic values. This involved a reduction in the cradle-to-grave carbon footprint of 0.9–1.3% and 0.6–0.8% with respect to the basic cases, as the brewery capacity increased from 500 to 2 million hL per year, as estimated by using the same life-cycle assessment (LCA) model of beer production developed previously (Cimini and Moresi, 2018c).
Moreover, the use of steel cans would give rise to lower effect than usage of glass bottles and aluminum cans not only on GHG emissions (BIER, 2012) but also on other environmental impact categories, such as eutrophication, creation of photochemical oxidants, and freshwater aquatic ecotoxicity potentials (Amienyo and Azapagic, 2016).
Any increase in glass or PET recycled content would improve the environmental sustainability of resulting bottles either for the lower energy needed for their manufacture or the minor quantity of post-consumption packaging waste to be landfilled. In fact, since the bottle emission factor linearly decreases as the recycled material content increases, 10% increase in the recycled glass or PET content reduced the carbon footprint of beer by 2.2–2.5% depending on the size of brewery (Cimini and Moresi, 2018c) or by approximately 3% in the case of glass bottles as estimated by Amienyo and Azapagic (2016). Except for water demand, all other environmental impact categories reduced by 0.5% in the case of eutrophication potential, and 2% in the case of abiotic depletion potential (Amienyo and Azapagic, 2016).
Thus, the idea of increasing recycling rate has proliferated in several countries. For instance, in France, mineral water in bottles made of 100% recycled PET (R-PET) has been commercialized since 2019. In Italy, usage of R-PET for producing bottles and trays for food was approved by the 2021 Budget Law on 31 December 2020 with the condition that the material derived from other bottles would be used for food purposes only. In Germany, thanks to the container deposit legislation operating since 1 January 2003 and despite the opposition of the German bottling industry and retailers, any empty plastic or glass bottle returned to a grocery store receives a credit ranging from €8 to 25 cents to be discounted at the cash desk. To avoid any contamination problem, recycling companies currently submit plastic bottles to the following procedure. First, such items are automatically collected using the barcode system, sorted by type and color, and aggregated in bales. Once foreign materials, labels and caps are removed by infrared-ray sorting and pre-washing, the resulting material is shredded into flakes, which are then dried at 150–180°C. The food reuse of such R-PET flakes involves a decontamination process of thermal or chemical type at 280°C or with a caustic detergent. This procedure has been also adopted by CORIPET (https://coripet.it/), a voluntary nonprofit consortium of producers, converters, and recyclers of PET bottles. The procedure was recognized as an autonomous system for the direct management of PET packaging of liquid foodstuffs by the Italian Ministry of Environment (see Decree No. 44 of 28 July 2021). Thanks to the deposit system adopted in Germany, 99% of refillable bottles and 97% of one-way bottles are returned to supermarkets and grocery stores (ANON, 2017). Thus, such a packaging waste recycling system must theoretically give rise to PET recycling rates near to 100%. To this end, CORIPET is intended to reach 25% PET recycling by 2025. In Germany, 96–98% R-PET recovery in 2015 supported the formation of new PET bottles from about 34% of total recovery, the remainder being directed to non-food uses, such as plastic sheets and films (27%), textile fibers (22.6), and so forth (Deutsche Welle [DW], n.d.).
The German container deposit legislation appears to be an appropriate incentive for transiting toward a circular economy, even if it has so far given rise to a greater aliquot for downcycling (66%) than for effective recycling and reuse, which indeed would strictly require the conversion of empty bottles into new useable bottles for food purposes. Strictly speaking, in the case of beverage packaging, a sustainable waste management must make use of refillable bottles only (ANON, 2017).
Since it is useless to reinvent the wheel, it is worth remembering that up to the early 1960s, the Italian customers used to pay a deposit on each glass bottle bought, which they reclaimed by returning the empty bottle. Obviously, such a system could become valid not only for glass bottles but also for plastic ones, even if the latter are refilled for 20–25 times and the former for up to 50 times (DW, n.d.). Of course, the reintroduction of reusable bottles demands not only for new infrastructure, financial incentives, and behavioral changes (Amienyo and Azapagic, 2016) but also for several other factors such as the distance empty bottles travel by road for cleaning and refilling, and the water and detergents used for the cleaning process. Such factors were accounted for the carbon footprint of beer in reusable 30-L stainless steel kegs was half of that of beer packed in 66-cL glass bottles (Table 4). Nevertheless, this cannot be decisive for reducing the environmental impact of beer, since 80.8% of beer sales are in glass bottles and just 11.7% in stainless steel kegs (Assobirra, 2020).
The environmental impact of returnable glass bottles was assessed either for beer in Portugal (Mata and COSTA, 2001) or for carbonated soft drinks in the United Kingdom (Amienyo et al., 2013). In both studies, the environmental load depended on the percentage of bottles returned and the number of times each bottle was reused. In the case of 50% reuse and up to six reuse cycles, returnable bottles reduced several impact categories, except eutrophication and ozone layer depletion (Mata and Costa, 2001). Global warming was reduced by ∼40%, as the glass bottles were reused just once, its minimum asymptotic value being achieved for eight reuses (Amienyo et al., 2013).
Before deciding which is really less environmentally -impacting among one-way, recycled, and or reusable beer packaging, the contribution of beer consumption phase (embracing not only beer refrigeration, dispensing, and losses but also consumer displacement and treatment of the wastewater formed) should be assessed, as specified by the beer product category rules (EPD, 2019; Technical Secretariat for the Beer Pilot [TSBP], 2016).
Normand et al. (2012) and Watson (2008) recommended the consumption of beer in kegs directly in pub, within a walking distance to avoid car use, especially if the pub was supplied directly from the neighboring brewery via pipelines. In addition, keg distribution was found to affect negatively the local traffic at historic sites, such as Bruges in Belgium (AFP, 2014), or during beer festivals, such as the October fest in Munich, Germany (Becker, 2014).
Since 64% of the Italian beer consumption is internal (Assobirra, 2020), it would probably be useful to attempt reducing the environmental impact of beer consumption by favoring the diffusion of returnable 10- to 30-L keykegs, made from 100% R-PET (https://www.keykeg.com), for summer time get-together parties at the expense of present day most popular beer formats available in the market (i.e., glass bottles and cans). In this manner, it could be possible to emulate the current success of 3- to 15-L bag-in-boxes for red and white wines available at both physical stores and online shops.
Spent filtration aids
Generally, spent filtration aids resulting from rough beer filtration are in the form of DE or Kieselguhr slurry, which is rich in suspended solids (e.g., diatom frustules, yeast, and hop and malt residues) and thus highly pollutant (Olajire, 2020). World Health Organization has classified such slurry as hazardous waste; moreover, its disposal costs in agriculture are as high as €170 per metric tons (Mg) (Fillaudeau et al., 2006). Nevertheless, owing to their high filtration rate and efficiency, DE dead-end filters are still largely used by the majority of breweries. In a large-size brewery, the specific consumption of DE is around 112 g hL-1 of beer, giving rise to ∼336 kg hL-1 of spent DE sludge (Cimini and Moresi, 2016).
After beer filtration, sludge is not recycled and generally landfilled. However, thanks to its high contents of available phosphorus (0.37–0.42 g kg-1), potassium (0.9–3.3 g kg-1), organic carbon (0.3 kg kg-1), and total nitrogen (0.02 kg kg-1), it is used in agriculture to improve soil fertility with no significant risk to the environment (Dessalew et al., 2017). The main potential reuse opportunities of this material include: (1) its recycling as additive to construction masonry materials, such as concrete, cement, and brick (Ferraz et al., 2011); and (2) its regeneration via chemical, physical, or biological methods. The latter up to now is unable to replace totally virgin DE (Olajire, 2020). Moreover, the thermal and acid or alkaline agent regeneration methods cannot be regarded as sustainable recycling methods because of their low efficiency and serious secondary pollution to the environment as well as high processing costs (Li et al., 2015). On the contrary, the biological methods appeared to be not only almost zero cost-effective but also capable of improving the adsorption capability of brewery-spent diatomite toward dyes and heavy metals from polluted wastewaters (Gong et al., 2019).
In order to decrease DE consumption and thus reduce DE sludge formation, it would be possible to resort to a cleaner filtration technology, such as cross flow microfiltration, which has been applied successfully in other food sectors over a long period of time (Cheryan, 1998). Unfortunately, so far, its application to beer clarification has been penalized by average permeation fluxes (50–100 L m-2 h-1) of about one-fifth of that obtainable (250–500 L m-2 h-1) with conventional kieselguhr filters (Buttrick, 2010), which are also dependent on the initial turbidity of rough beer (Cimini and Moresi, 2014). Only by submitting pre-centrifuged rough beer to a specific enzymatic (i.e., Brewers Clarex®) treatment and then to clarification at 30°C using ceramic 1.4-μm hollow-fiber membrane modules, it was possible to limit the in-bottle chill-haze formation more effectively than with the PVPP treatment, and what is more to enhance the average permeation flux up to 2,000 L m-2 h-1 with no filtration residues to be disposed of (Cimini and Moresi, 2018a,b, 2020). Final polishing of the resulting beer permeates through 0.45-μm cartridge filter, resulting in a brilliant, colloidally stable, and microbiologically safe beer ready to be packed aseptically without any thermal pasteurization (Cimini and Moresi, 2020).
End of Life of Brewing Biotic Materials
In large-size breweries, wet BSGs, as well as hot trub and BSY, are generally used as feed supplement for both ruminants and nonruminants (Cimini and Moresi, 2016; Kerby and Vriesekoop, 2017). How craft breweries generally deal with the disposal of their byproducts is practically unknown, especially in Italy. By resorting to the information provided by 90 British craft brewers interviewed by Kerby and Vriesekoop (2017), BSGs were destined to feed formulation by about 94% of the rural craft breweries, while the remainder was nearly equally directed to composting or landspreading. The urban counterparts exhibited almost the same disposal scenario, although in smaller craft breweries the percentage of BSGs used as feed ingredient reduced to ∼76% at the expense of that converted into compost (20%). It was also noted that a large rural brewery worked in partnership with a local pig farmer to breed pigs with BSG and serve the resulting pork meat in its own tap house. Altogether, animal feed was the primary route of BSG disposal, this mirroring the practices of industrial-size breweries.
Regarding spent hops/hot trub, their residual bitterness prevents them from being used as an animal feed. Nevertheless, owing to its minimum amount (0.2–0.4 kg hL-1 beer; Table 1), such a byproduct can be appropriately added to BSG to formulate feed that is not rejected by cattle. Nevertheless, the UK craft breweries appeared to reuse it as fertilizer (∼40%) or compost (∼40%) or dispose it of in the landfill (7–10%), as reported by Kerby and Vriesekoop (2017).
Even if the majority of breweries reuses yeast to inoculate the next batch of wort, 2–4 kg of surplus yeast per hectoliter of beer (Table 1) is disposed of as BSY. Among the smaller rural and urban craft breweries, the primary disposal method (55–60% of the overall amount) was through municipal sewage system, although such percentage decreased with increase in the size of brewery. Altogether, 10% of small urban craft breweries, as well as 20% of medium- and larger-size rural craft breweries, got rid of BSY as animal feed. Similar proportions were used for composting and fertilizing purposes. Other uses, such as mixed substrate for anaerobic digestion or inoculum for the fermentation step of a distillery, were additionally pointed out by Kerby and Vriesekoop (2017).
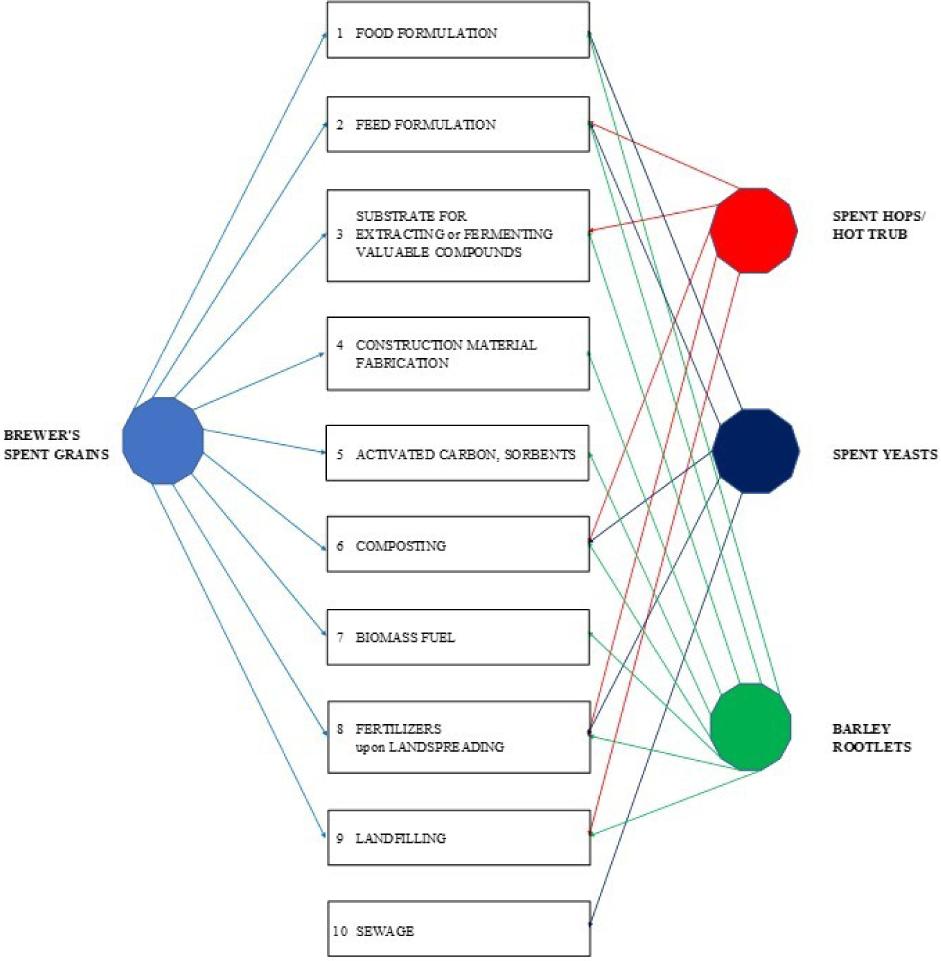
The techno-scientific literature is full of proposals about the potential uses of brewery wastes (Aliyu and Bala, 2011; Cook, 2011; Huige, 2006; Jackowski et al., 2020; Karlović et al., 2020; Kusch-Brandt et al., 2019; Mussatto, 2009; Neylon et al., 2020; Rachwal et al., 2020). Despite, they are acclaimed as a panacea for most of the world’s problems, their high moisture content (Table 1) makes them perishable very quickly and de facto unreusable, especially in the human food chain. By accounting for the waste hierarchy set out by Directive 2008/98/EC (EU, 2008) and Garcia-Garcia et al. (2015), Figure 4 shows a ranking of their potential upgrading proposals.
Figure 4. Potential uses of main brewery wastes (e.g., barley rootlets, brewer’s spent grain, spent hops/hot trub, brewer’s spent yeast) as described in the literature and ranked according to the food waste hierarchy set out by Directive 2008/98/EC (EU, 2008) and Garcia-Garcia et al. (2015).
Malt barley rootlets
Malt barley rootlets (MBR) are removed from malted barley, since they impart a bitter aftertaste to beer (Karlović et al. 2020). Table 6 classifies their potential applications in accordance with the food waste hierarchy illustrated in Figure 4.
Table 6. Main potential uses of malt barley rootlets (MBR) as classified according to the food waste hierarchy shown in Figure 3.
| Food waste hierarchy | Main MBR reuses | Remarks and references |
|---|---|---|
| 1 | Food formulation | Neylon et al. (2020) listed a series of food products, such as bread, biscuits, and sausages, enriched with different aliquots of MBRs as such (Chiş et al., 2020) or fermented with Lactobacillus plantarum sp. (Waters et al., 2013) to improve their nutritional properties. |
| 2 | Feed additive | MBRs are generally blended with other malting byproducts (e.g., barley dust, malt dust, and small-size barley grains) and compressed to obtain the so-called malt residual pellets with a bulk density and a protein content of about 600 kg m-3 and 18% (w/w), respectively (The Maltsters Association of Great Britain [MAGB], n.d.). Owing to the potential high risk of being contaminated by mycotoxins, such pellets must be appropriately dosed before feeding, for instance, weaner piglets, which are as sensitive to zearalenone as humans (MAGB, n.d.). |
| 3 | Source of enzymes | MBRs are a source of invertase, superoxide dismutase, nucleases, phosphotransferase, phosphomonoesterase, and especially 50-phosphodiesterase (Neylon et al., 2020). In particular, the latter is used commercially to make nucleotides (Sakaguchi et al., 1963; Sakaguchi and Kuninaka, 1965) for enhancing the flavor of broths and soups (Yamaguchi, 1998). |
| Source of multicomponent extracts | MBRs are also a source of natural antioxidants, including ascorbic acid and glutathione, potentially useable in food and cosmetics (Bonnely et al., 2000). | |
| Microbial growth substrate | MBRs were used as a cheap growth and storage medium for lactic acid bacteria (Neylon et al., 2020). It had an estimated 20% lower price with respect to that of the conventional de Mann, Rogosa, Sharpe growth media (Laitila et al., 2004). | |
| Bioproduct substrate | Hydrolysates of MBRs and brewers’ spent grains were used as substrate for lactic acid production (Radosavljević et al., 2020). | |
| 5 | Activated carbon | MBRs were converted into biochar upon heating at ∼450°C in a pyrolysis plant (Chan et al., 2007). Its application at rates more than 50 Mg/ha in conjunction with N fertilizer (100 kg N/ha) improved not only the fertilizer effectiveness but also soil quality (Chan et al., 2007). The biochar sorbent properties for several water contaminants (e.g., chlorine, chloroform, chromium, mercury, methylene blue, phenanthrene, trimethoprim, and uranium) were reported by Grilla et al. (2020) and Neylon et al. (2020). Untreated MBR biochar was also used as a catalyst in the transesterification step of biodiesel production (Tsavatopoulou et al., 2020). |
| 6 | Composting | |
| 9 | Landfilling |
If their mycotoxin content is low, MBRs should be first used as a food ingredient, thanks to their high protein and fiber contents (Table 1). Some of their applications are summarized in Table 6. Regardless of representing the second priority choice (Figure 4), MBRs are nowadays quite exclusively utilized by the animal feed industry (Table 6). As the third priority choice, MBRs could be used as substrate for extracting several valuable products, such as enzymes and antioxidants, or for microbial cultivation and fermentation. The Achilles’ heel of their extraction processes is the need for complex and expensive purification steps to fractionate the enzyme of choice from quite numerous other unsought enzymes. In fact, it was found to be more effective and easier to obtain nucleotide extracts from the autolysis of selected high-ribonucleic acid containing baker’s yeasts than from MBRs (Sombutyanuchit et al., 2001). In addition, the commercial interest for using such extracts in food and cosmetics is limited due to high operating costs of their extraction processes (Bonnely et al., 2000). Concerning their use as an economic alternative to the conventional de Mann, Rogosa, Sharpe growth media (Laitila et al., 2004), it must be remarked that such investigations were performed in laboratories only and did not account for the market size of such a growth medium and thus for its real processing costs, as well as the impact of MBR market price on the final product. Finally, the so-called optimized lactic acid production from BSG and MBR hydrolysate by Radosavljević et al. (2020) did not account for the problematic recovery of lactate from such an exhausted production medium. This phase would be by far more complex than the traditional one (Moresi and Parente, 1999), which relies on the purer carbon sources (e.g., raw sugar extracted from sugar beet or sugarcane, and corn starch hydrolysates) used by world’s largest lactate manufacturers such as BASF, Galactic, Musashino Chemical, and Dow (Grand View Research [GVR], 2021). As the fifth priority choice being reported in Table 6, MBRs are converted into biochar, its use for soil amendment (Chan et al., 2007), as a sorbent for several water contaminants (Grilla et al., 2020; Neylon et al., 2020), or as a catalyst in the transesterification step of biodiesel production (Tsavatopoulou et al., 2020).
Finally, as the least preferable waste management options, MBRs might in all probability be used for composting and landfilling (Table 6).
Brewer’s spent grains
Figure 4 shows how the food waste hierarchy specified by Directive 2008/98/EC (EU, 2008) could be applied to manage the disposal of BSG according to circular economy template.
In the first place, because of their high protein and fiber contents (Table 1), such spent grains could be used in the food industry. The technical literature reports quite an innumerable list of food applications (Aliyu and Bala, 2011; Cook, 2011; Huige, 2006; Jackowski et al., 2020; Karlović et al., 2020; Mussatto, 2009; Rachwal et al., 2020). Table 7 lists such applications in accordance with the food waste hierarchy shown in Figure 4.
Table 7. Main potential uses of brewer’s spent grain (BSG) as classified according to the food waste hierarchy shown in Figure 3.
| Food waste hierarchy | Main BSG reuses | Remarks and references |
|---|---|---|
| 1 | Partially exhausted raw material | It can be recovered from the uppermost layers of BSG discharged after lautering. Since it contains undigested starch, it might be integrated with appropriate doses of fresh malt and reused in the subsequent wort batch to produce low-alcohol or alcohol-free beers (Zürcher and Gruss, 1990). |
| High-protein and high-fiber containing ingredient | It was used to:
| |
| Main substrate for probiotic beverages | Upon suspension of 200 g L-1 of pre-ground BSG in sterile water, and fermentation of the resulting medium with Bacillus subtilis WX-17 (i.e., rod-shaped, Gram-positive bacteria generally recognized as key health promoter), it was recovered as a liquor rich in viable cells (7.2 × 10⁹ CFU mL-1), several essential amino acids, and citric acid cycle intermediate metabolites, and with a high antioxidant activity (Tan et al., 2020). | |
| 2 | Feed additive | BSG can be used to feed
|
| 3 | Source of proteins | The recovery of proteins, as such or hydrolyzed to formulate vegan foods, asks for quite complex extraction and purification processes using alkaline (Du et al., 2020) and/or acid solutions (Qin et al., 2018), subcritical water at 200°C and 40 bar (Du et al., 2020) or 185°C and 50 bar (Alonso-Riaño et al., 2021), hydrothermal pretreatment at 60°C, ultrasound-assisted enzymatic pretreatment (Yu et al., 2020), or steam explosion (Rommi et al., 2018). |
| Source of polyphenolics | Recovery of polyphenolics was performed using quite different processes, namely alkaline hydrolysis, enzymatic hydrolysis, acetone–water, or ethanol–water extraction as such or assisted by ultrasound or microwave, or supercritical carbon dioxide extraction (Jackowski et al., 2020; Karlović et al., 2020; Rachwal et al., 2020; Stefanello et al., 2018. | |
| Source of arabinoxylan (AX) | Such polysaccharide consists of two monomers (xylose and arabinose) and may be recovered from BSG using the integrated process as set up by VIeira et al. (2014) where increasing concentrations of KOH or NaOH allowed ∼83% of total proteins and ∼70% of total arabinoxylan to be extracted sequentially. The efficiency of such a process was further improved with the help of ultrasound (Reis et al., 2015) or microwaves (Coelho et al., 2014). | |
| Source of multicomponent extracts | These were recovered by submitting BSG or other brewery wastes to water leaching under moderate conditions (Almendinger et al., 2020). Their carbohydrate or amino acid concentration was generally smaller than 10 mg per g DM or 2 mg per g DM, respectively. Thus, their biological activity should be significantly enhanced to be properly utilized in cosmetic products (Almendinger et al., 2020). | |
| Source of cellulose nanofibers | Such nanofibers could be used as emulsion or dispersion agents in food preparations (Rachwal et al., 2020). Their recovery from dried BSG required quite a complex procedure consisting of the following steps: primary alkaline treatment with 0.1-M NaOH at 60°C for 2 h to get rid of proteinaceous matter; bleaching of the lignocellulose residue with 0.7% (w/v) sodium chlorite at a boiling point for 2 h; filtering and residue resuspension in 5% (w/v) sodium bisulfite at room temperature for 1 h; filtering and washing with distilled water; secondary alkaline treatment with 17.5% NaOH at room temperature for 8 h; washing and dispersion in water at 1.5% (w/v); and final homogenization at 700–800 bar for 20 cycles (Mishra et al., 2017). However, no information about their processing costs is available. | |
| Microbial growth substrate | It was used as a growth substrate for several microorganisms, such as Escherichia coli, actinobacteria, Bifidobacterium adolescentis, Lactobacillus spp., and yeasts in alternative to expensive nitrogen sources, such as yeast extract and peptone (Cooray et al., 2017; Rachwał et al., 2020). | |
| Mushroom substrate | It was used to cultivate mushrooms, such as Pleurotus ostreatus, Lentinula edodes, and Hericium erinaceus. The trials carried out at the Mycoterra Farm (Westhampton, MA, USA) suggested not only that BSG should be handled with care to avoid cross-contamination of laboratory environment but also that grain savings from BSG substitution were not so significant to support such a use financially, especially in spawn stages (Mycoterra Farm, 2015). | |
| Bioproduct substrate | BSG was used as substrate for several bioproducts (Rachwał et al., 2020), such as succinic acid (Cooray et al., 2017), microbial oil (Saenge et al., 2011), fatty acids and carotenoids (Zalynthios and Varzakas, 2016), xylitol (Mussatto and Roberto, 2008), pullulan (Singh and Saini, 2012), or citric acid (Femi-ola and Atere, 2013). | |
| Microbe-immobilizing carrier | It was used to immobilize yeasts (Brányik et al., 2001). | |
| 4 | Additive for bio-composites | BSG was used as an environment-friendly reinforcement or filler component in:
|
| 5 | Activated carbon | BSG, as such or pelletized, was converted into biochar via pyrolysis and micro-gasification under high-temperature (400–500°C) and low-oxygen conditions with an average yield of 18.6% (w/w) (Sperandio et al., 2017). Activated carbon from BSG exhibited adsorption capacity for metallic ions, phenolic compounds, and color quite similar or even effective than that of their commercial counterparts (Mussatto et al., 2010). |
| 6 | Composting | A proper dosage of wet BSG with a lignocellulosic bulking agent (e.g., wheat straw) and sheep or pig manure favored its appropriate composting (Assandri et al., 2021). |
| 7 | Biomass fuel | BSG could be used as a:
|
| 8 | Organic fertilizer | BSG might be used as:
|
| 9 | Landfilling | Wet BSG is landfilled by 7–10% of the UK craft breweries (Kerby and Vriesekoop, 2017). |
In particular, the BSG fortification of food products had no effect on the taste, smell, and consistency of the final product of choice, as well as on its appreciation by the end consumer on condition that it was not greater than 10% (w/w) in dry pasta (Nocente et al., 2019) or 25–30% (w/w) in bread (Stojceska et al., 2008) and snacks (Petrovic et al., 2017). Of course, such fortified foods had greater fiber content and a lower glycemic index (Kirjoranta et al., 2016). When 15 parts of BSG were homogenized with a pre-emulsion made of 5 parts of carboxymethyl cellulose and 80 parts of ice, such addition to chicken meat batters at 20–25% level resulted in reduced-fat chicken sausages with an overall sensory acceptability not statistically different from that of a reference product prepared with 15% pork back fat (Choi et al., 2014). On the contrary, conventional chicken patties exhibited net improvement in their cooking loss, consistency, color, and sensory properties if they included no more than 3% BSG (Kim et al., 2013). BSG was also used to prepare a probiotic drink (Tan et al., 2020). However, since experimental trials have been so far performed in Erlenmeyer flasks with no sensory tests and no cost–benefit analysis, such alternative use of BSG as a novel nutritional beverage appears to be very premature. Even other food applications listed in Table 7 have been tested in laboratory only. Nevertheless, as Anheuser-Busch InBev, a leading brewer of the United States, realized that it had to dispose of about 1.4 million Mg of BSG annually, it started a new company called EverGrain to convert BSG into a low-starch, proteinaceous, and fibrous material at a pilot-scale plant at Newark (New Jersey, USA). Owing to its successful use in the preparation of several foods and beverages (e.g., plant-based milk, bread, pizza crust, pasta, granola bars, meat alternatives, and smoothies), EverGrain decided to build its first full-scale production facility at Anheuser-Busch’s historic headquarter in St. Louis, Missouri (EverGrain, 2021). Thus, it is highly probable that more amounts of BSG would be utilized in the food sector and no more diverted to the second option of food waste hierarchy depicted in Figure 4.
The second waste disposal prospect (Figure 4) is used by most of the industrial and craft breweries to dispose of fresh BSG as feed additive in animal and insect nutrition (Table 7). To this end, under the EU Regulation No. 183/2005 (EU, 2005), food companies (including breweries) willing to sell their byproducts as feed materials are to register with their local authorities and develop a specific hazard analysis and critical control point (HACCP) plan to comply with traceability requirement and keep the risk of biological, chemical, and physical contamination of food wastes as low as practically attainable. Additionally, because of high moisture content (Table 1), BSG is so perishable that it must be fed within 2 or 3 days of manufacture unless it is stored at 5°C, dried or pickled (Jackowski et al., 2020). Whereas its drying is hardly practiced, since the high operating costs are not rewarded by the final feed use, pickling is a low-cost operation capable of extending the shelf life of BSG with no counter effects on its quality (Jackowski et al., 2020).
The third waste disposal prospect (Figure 4) involved the use of BSG as substrate for extracting proteins, polyphenolics, arabinoxylan (AX), and cellulose nanofibers, or for microbial growth and fermentation, as summarized in Table 7.
The recovery of proteins from BSG is not an easy task. For instance, upon suspending about 100-g BSG in 1 L of aqueous NaOH (pH > 11) at 40°C for 2 h, and centrifuging, it was possible to recover a protein-rich precipitate with an extraction yield of about 21% and purity of 60% (DU et al., 2020). Further extraction of such a residue with subcritical water at 200°C and 40 bar for 20 min enhanced protein extraction yield by an extra 7% (DU et al., 2020). Subsequent alkaline and dilute acid pretreatments boosted the extraction yield to ∼95% with the counter effects of greater solubilization of carbohydrates and lignin and a lower purity of proteins—this making by far more difficult the protein separation and purification steps (Qin et al., 2018). Similar problems affect the recovery of polyphenolics and arabinoxylans from BSG (Jackowski et al., 2020; Karlović et al., 2020; Rachwal et al., 2020). Moreover, the resulting extracts rich in ferulic and p-coumaric acids had to be micro-encapsulated not only to mask their pungent odor and bitter taste conveyed to fortified fish burger but also to prevent their degradation (Spinelli et al., 2016).
Finally, the suggested use of BSG as inexpensive substrate for several bioproducts (Rachwał et al., 2020) relies on tests carried out in laboratory with no account for their feasibility and processing costs in pilot and/or industrial plant. The use of BSG as a remunerative substrate per citric acid production was, for instance, just puerile, since it was drawn in the absence of any comparison among the citric acid yield factors and production rates in laboratory and industrial plant. Moreover, it is not known which bioproduct recovery and purification steps are to be used when dealing with a multicomponent matrix such as BSG instead of glucose syrups currently utilized (Moresi and Parente, 1999) by the world’s largest citric acid manufacturers such as Anhui, Archer Daniels Midland, Cargill, Huangshi Xinghua Biochemical, Jungbunzlauer, Tate & Lyle, etc. (GR-Store, 2021).
In accordance with the fourth and fifth waste management options (Figure 4), BSG could be used to reinforce different biocomposites or produce activated carbon and biochar, as provided in Table 7. Even if the adsorption capability of biochar might help to improve water and chemical fertilizer retention in agricultural soils, as well as limit their nitrate leaching and N2O and CH4 emissions, no cost–benefit analysis has been carried out so far.
Concerning the sixth waste management option (Figure 4), BSG may be composted on condition that it is mixed with wheat straw and sheep or pig manure to adjust its initial moisture content (60–65% w/w), carbon/nitrogen (C/N) ratio (20:30), and pH (5.5–7.5) (Assandri et al., 2021).
The seventh waste disposal option shown in Figure 4 refers to the utilization of dried BSG as a solid biomass—its lower heating value ranging from 76 to 90% of 15–18 MJ kg-1 of the majority of solid biomasses with ∼10% moisture content (Paládi, 2013).
Regarding hydrothermal carbonization of wet BSG, the resulting hydrochar could be used as biofuel, feedstock for gasification, soil additive for nutrient enrichment, adsorbent, or precursor of activated carbon (Jackowski et al., 2019).
Although no information is currently available about the economic practicability of BSG conversion into hydrobiochar or bioethanol, production of biogas from BSG was regarded as economically unviable unless the process included coproduction of other more profitable products (González-García et al., 2018). The enzymatic hydrolysis of cellulose, hemicellulose, and lignin would facilitate the release of fermentable sugars and thus improve the conversion yield into bioethanol or biomethane per unit mass of the lignocellulosic material consumed. However, it is still unknown, how the market price of commercial cellulolytic enzymes would affect the biofuel production costs.
As given in Table 7, BSG might be disposed of as an organic fertilizer per se or pre-fermented to be effective against soil-born insects (Qiu et al., 2019).
Finally, BSG could be landfilled as the least preferable waste management alternative as shown in Figure 4.
Most of the above-mentioned potential uses of BSG are also elucidated by a recent bibliometric analysis carried out by Sganzerla et al. (2021), where up to 510 papers over the last 30 years were retrieved from the Web of Science© database. Globally, 65 countries have been involved in studies linked to BSG, and Brazil has been the most productive nation with up to 70 papers. It was demonstrated that a great interest existed in the valorization of BSG, even if no feasibility study was identified to sustain any of such research activities on an industrial scale. Although a bibliometric study pointed out the possibility of developing a biorefinery using BSG as raw material, it underlined the difficulty of identifying the most appropriate and economically viable chemico-physical or enzymatic processes applicable to upgrade the product yield of choice as well as to lower their environmental effects.
Spent Hops/Hot Trub
Figure 4 shows the main disposal methods of spent hops/hot trub, these being ranked according to the above-mentioned food waste hierarchy. Beyond the methods reviewed by Kerby and Vriesekoop (2017), it is worthy pointing out the possibility of fractionating about 0.11 g of a series of mono- and sesqui-terpenes from 100 g of dry HT by hydrodistillation—these essential oils acting as natural repellents against two Coleoptera (i.e., Rhyzopertha dominica and Sitophilus granaries) that cause big economic loss to stored foods (Bedini et al., 2015). Obviously, even in this case no cost–benefit analysis was carried out to measure the real applicability for such eco-friendly repellents.
Brewer’s Spent Yeast
Figure 4 illustrates the real and potential disposal methods of BSY as classified according to the above-mentioned food waste hierarchy.
Although BSY has long been used to produce a dark-brown food spread named Marmite (this being invented by the German scientist, Justus Freiherr von Liebig, and nowadays produced by Unilever in the United Kingdom), none of the 90 craft breweries interviewed by Kerby and Vriesekoop (2017) supplied BSY to any Marmite factory, probably because of the small amounts available. Marmite is a rich source of vitamin B complex, which is spread on bread, toast, or crackers and imparts the so-called umami taste, typical of the amino acid L-glutamate and 5’-ribonucleotides. Its main analogues are the Australian Vegemite, Swiss Cenovis, Brazilian Cenovit, and German Vitam-R (Wikipedia, 2021).
Owing to its high protein content (Table 1), BSY can be converted into protein concentrates and isolates (Karlović et al., 2020). It is directly added to energy bars in the proportion of 10–30% (w/w) to significantly increase their protein and phytic acid contents as well as density (Stojceska et al., 2008). BSY is used as a source of food-grade yeast extracts. NaCl- or saponin-induced autolysis of cell yeast gives rise to yeast extracts containing different free amino acid contents as well as peptides of diverse molecular masses. In this manner, these can be used to tailor-make novel functional foods having peculiar taste profiles, or more conventionally to enhance the flavor of food products by dosing appropriately specific components, namely, nucleotides, peptides, and amino acids (mainly glutamic acid; Podpora et al., 2016).
Notwithstanding the fact that it is used to formulate animal feed as the second option of the above-mentioned food waste hierarchy (Figure 4), wet BSY combined with BSG and hot trub is primarily sold to farmers as a low-cost feed additive, especially by large-size breweries (Cimini and Moresi, 2016).
Owing to its high moisture content and chemical composition (Table 1), BSY degrades easily. Thus, before being administrated to animals, BSY must be dried or stabilized by adding organic acids to avoid its fermentation in the gastrointestinal tract of animals, especially pigs, which are highly sensitive to such disorders (Crawshaw, 2004). Wet BSY is mainly used to feed cattle, but its high digestibility has to be checked for other animals, such as fish, horses, turkeys, hens, and swine (Crawshaw, 2004).
The third waste management option in Figure 4 suggests using BSY as a source of several useful compounds, such as enzymes (Ferreira et al., 2010) and especially invertase (De León-González et al., 2016), polyphenolics (Vieira et al., 2016), ergocalciferol used in vitamin D deficiency (Metzger et al., 2012), saccharides such as β-glucans (Thammakiti et al., 2004), and trehalose (Mahmud et al., 2010). In particular, β-glucans extracted from BSY are used to replace partially fat in mayonnaise to lower its energy value and improve its storage stability (Worrasinchai et al., 2006). BSY are also used as a growth medium for Lactobacilli and Pediococci (Champagne et al., 2003).
All the above-mentioned BSY applications are experimented in laboratory without any cost–benefit analysis to assess their real feasibility.
Finally, BSY can be used as a fertilizer by composting or land spreading, although these waste management options are the least preferred ones to be applied (Figure 4).
Concluding remarks
To conclude, this analysis was about the potential utilization of brewery wastes. It is worth summarizing the results of an economic market analysis carried out by Buffington (2014) on the assumption of feeding a bio-refinery located centrally with respect to two large-size beer manufacturers in the United States with their BSGs shipped “as-is,” that is, with an average moisture content of 70% (w/w). Since the current acquisition cost of other alternative agroforestry wastes, such as stalks and straws, at an average moisture content of ∼10% (w/w) is around US$40 Mg-1, the effective acquisition cost for BSG would be US$133.30 per dry Mg. Moreover, accounting for the depreciation costs of bio-refinery, drying and storage processing costs of BSG, logistic costs, and a 5% net profit, the processed BSG market price would increase up to US$179 Mg-1. In this scenario, using BSG, as well as other brewery wastes, as a biomass feedstock appears to be in no manner market-justifiable. Moreover, direct disposal of malting and brewery byproducts as animal feed is the primary option for small-, medium-, and large-size breweries, since it represents an avoided production of feed and gives rise to quite a significant CO2e credits equaling to about one-third of the contribution of packaging materials (Table 5).
Conclusions
In the light of the concept of circular economy, the brewing chain is expected to deal with the reuse of abiotic (e.g., packaging materials and spent kieselguhr sludge) and biotic (e.g., brewery wastes) materials to approach the zero-waste objective.
The pros and cons of different packaging alternatives (e.g., one-way, lighter, reusable, or recycled containers) were analyzed. Even if the contribution of beer consumption phase was taken into account, there was no definitive result about the less environment-impacting beer packaging format. Autonomous system for the direct management of PET packaging for liquid foodstuffs, recently recognized by the Italian Ministry of the Environment, might help to make available 100% R-PET flakes ready to be reconverted into food-grade bottles with minimum downcycling to other non-food uses.
Concerning numerous studies suggesting alternative utilization of brewery wastes in nutritional as well as biotechnological fields, it was pointed out that the majority of these was just tested in laboratory and included no cost–benefit or market analysis. Even when the concept of biorefinery was stressed upon as an interesting strategy to upgrade brewery wastes, none of the final bioproducts obtained seems to be market-justifiable, mainly because the estimated market price of dried BSG was about 450% higher than that of conventional lignocellulose residues. Except for the Anheuser-Busch’s initiative of quickly converting wet brewer’s grains into a low-starch and high-protein and high-fiber containing ingredient for foods and beverages, the high moisture content of all brewery wastes makes them perishable to prevent their safe usage in the human food chain. Their prompt use as an animal feed appears to be the only disposable method not only economically feasible but also able to lower by about one-third the GHG load of packaging materials. Not by chance, it is currently practiced by both industrial and craft breweries. All other alternative uses, hailed in the literature as a panacea for most of global problems, appear to be more useful for publishing articles than for defining any economically feasible reusing procedure for all the brewery wastes of concern. Under these circumstances, to support its transition toward a circular economy, the beer industry must primarily reduce, reuse, recycle, and recover as much as possible the beer packaging materials.
Acknowledgments
This research was supported by the Italian Ministry of Instruction, University and Research, with special grant PRIN 2015 – prot. 2015MFP4RC_002.
REFERENCES
AFP. 2014. Bruges to build beer pipeline to stop traffic ruining locals' lives. The Telegraph, 24 Sep. 2014. Available at: http://www.telegraph.co.uk/finance/newsbysector/retailandconsumer/11117320/Bruges-to-build-beer-pipeline-to-stop-traffic-ruining-locals-lives.html (accessed 12 Sep 2021).
Alijošius S., Švirmickas G.J., Kliševičiūtė V., Gružauskas R., Šašytė V., Racevičiūtė-Stupelienė A., Daukšienė A., and Dailidavičienė J. 2016. The chemical composition of different barley varieties grown in Lithuania. Veterinarija Ir Zootechnika (Vet Med Zoot). 73(95): 9–12.
Aliyu S. and Bala M. 2011. Brewer’s spent grain: a review of its potentials and applications. Afr J Biotechnol. 10(3): 324–331. 10.5897/AJB11.2761
Almendinger M., Rohn S., and Pleissner D. 2020. Malt and beer-related by-products as potential antioxidant skin-lightening agents for cosmetics. Sustain Chem Pharm. 17: 100282. 10.1016/j.scp.2020.100282.
Alonso-Riaño P., Sanz M.T., Benito-Román O., Beltrán S., and Trigueros E. 2021. Subcritical water as hydrolytic medium to recover and fractionate the protein fraction and phenolic compounds from craft brewer’s spent grain. Food Chem. 351: 129264. 10.1016/j.foodchem.2021.129264
Amienyo D. and Azapagic A. 2016. Life cycle environmental impacts and costs of beer production and consumption in the UK. Int J Life Cycle Assess. 21(4): 492–509. 10.1007/s11367-016-1028-6
Amienyo D., Gujba H., Stichnothe H., and Azapagic A. 2013. Life cycle environmental impacts of carbonated soft drinks. Int J Life Cycle Assess. 18: 77–79. 10.1007/s11367-012-0459-y
Anon. 2017. Reusable packaging in Europe: boosting business and closing the loop. Conference-Book of 6th European Reuse-Conference, Brussels, 23 March 2017. Available at: https://www.reloopplatform.org/wp-content/uploads/2017/03/170619_ReUse_Conference_2017_Conference_Book_FINAL.pdf (accessed 12 Sep. 2021).
Assandri D., Pampuro N., Zara G., Cavallo E., and Budroni M. 2021. Suitability of composting process for the disposal and valorization of brewer’s spent grain. Agriculture. 11(1): 2. 10.3390/agriculture11010002
Associazione dei Birrai e dei Maltatori (Assobirra). 2020. Annual report 2020. Assobirra, Rome, Italy. Available at: https://www.assobirra.it/annual-report-assobirra/ (accessed 05 Aug 2021).
Barchet R. 2019. Hot trub: formation and removal. Available at: https://www.morebeer.com/articles/Hot_Trub_Formation_And_Removal (accessed 12 Aug 2021).
Becker A. 2014. Siemens technology controls the beer pipeline in the Hacker Festival Tent. Siemens AG München, Germany. Available at: https://assets.new.siemens.com/siemens/assets/api/uuid:1eb80bf1-4216-4ac4-9658-22a75698968c/infographic-beer-pipeline-e.pdf (accessed 12 Sep 2021).
Bedini S., Flamini G., Girardi J., Cosci F., and Conti B. 2015. Not just for beer: evaluation of spent hops (Humulus lupulus L.) as a source of eco-friendly repellents for insect pests of stored foods. J. Pest Sci. 88: 583–592. 10.1007/s10340-015-0647-1
Beloborodko A., Žogla L., and Rošã M. 2014. Efficient use of energy in small size brewery. In: 17th European Roundtable on Sustainable Consumption and Production: book of abstracts, Slovenia, Portorož, Oct 14–16, p. 151. Available at: https://issuu.com/nada.strizic/docs/book_of_abstracts (accessed 12 Aug 2021).
Beverage Industry Environmental Roundtable (BIER). 2012. Research on the carbon footprint of beer. Beverage Industry Environmental Roundtable, June 2012. Available at: http://bierstaging.wpengine.com/publication/beer/ (accessed 07 Sep 2021).
Bocconi University, Ellen MacArthur Foundation, Intesa Sanpaolo. 2021. The circular economy as a de-risking strategy and driver of superior risk-adjusted returns. Available at: https://emf.thirdlight.com/link/29wifcw68gx1-yw31dj/@/preview/1?o (accessed 14 Aug 2021).
Bonnely S., Peyrat-Maillard M.N., Rondini L., Masy D., and Berset C. 2000. Antioxidant activity of malt rootlet extracts. J. Agric. Food Chem. 48: 2785–2792. 10.1021/jf990793c
Bougrier C., Dognin D., Laroche C., Gonzalez V., Benali-Raclot D., and Cacho Rivero J.A. 2018. Anaerobic digestion of brewery spent grains: trace elements addition requirement. Bioresour Technol. 247: 1193–1196. 10.1016/j.biortech.2017.08.211
Brányik T., Vicente A.A., Cruz J.M.M., and Teixeira J.A. 2001. Spent grains—a new support for brewing yeast immobilisation. Biotechnol. Lett. 23: 1073–1078. 10.1023/A:1010558407475
Buffington J. 2014. The economic potential of brewer’s spent grain (BSG) as a biomass feedstock. Adv Chem Eng Sci. 4: 308–318. 10.4236/aces.2014.43034
Buttrick P. 2010. Choices, choices. Beer processing and filtration. Brew Dist Int. 6(2): 10–16.
Cappa C. and Alamprese C. 2017. Brewer's spent grain valorization in fiber-enriched fresh egg pasta production: Modelling and optimization study. Food Sci Technol (LWT) 82: 464–470. 10.1016/j.lwt.2017.04.068
Champagne C.P., Gaudreau H., and Conway J. 2003. Effect of the production or use of mixtures of bakers or brewers’ yeast extracts on their ability to promote growth of Lactobacilli and Pediococci. Electron J Biotechnol. 6: 185–197. 10.2225/vol6-issue3-fulltext-3
Chan K.Y., Van Zwieten L., Meszaros I., Downie A., and Joseph S. 2007. Agronomic values of green waste biochar as a soil amendment. Aust J Soil Res. 45: 629–634. 10.1071/SR07109
Cheryan M. 1998. Ultrafiltration and Microfiltration Handbook. Technomic, Lancaster, PA, USA.
Chiş M.S., Pop A., Paucean A., Socaci S.A., Alexa E., Man S.M., Bota M., and Muste S. 2020. Fatty acids, volatile and sensory profile of multigrain biscuits enriched with spent malt rootles. Molecules. 25: 442. 10.3390/molecules25030442
Choi M.-S., Choi Y.-S., Kim H.-W., Hwang K.-E., Song D.-H., n Lee S.-Y., and Kim C.-J. 2014. Effects of replacing pork back fat with brewer's spent grain dietary fiber on quality characteristics of reduced-fat chicken sausages. Korean J Food Sci Ann. 34(2): 158–165. 10.5851/kosfa.2014.34.2.158
Cimini A. and Moresi M. 2014. Beer clarification using ceramic tubular membranes. Food Bioproc Technol. 7(9): 2694–2710. 10.1007/s11947-014-1338-2.
Cimini A., and Moresi M. 2015. Novel cold sterilization and stabilization process applied to a pale lager. J. Food Eng., 145: 1-9. 10.1016/j.jfoodeng.2014.08.002
Cimini A. and Moresi M. 2016. Carbon footprint of a pale lager packed in different formats: assessment and sensitivity analysis based on transparent data. J. Clean. Prod. 112: 4196–4213. 10.1016/j.jclepro.2015.06.063
Cimini A. and Moresi M. 2018a. Combined enzymatic and crossflow microfiltration process to assure the colloidal stability of beer. Food Sci Technol (LWT). 90: 132–137. 10.1016/j.lwt.2017.12.008
Cimini A. and Moresi M. 2018b. Towards a Kieselguhr-and PVPP-free clarification and stabilization process of rough beer at room-temperature conditions. J Food Sci. 83(1): 129–137. 10.1111/1750-3841.13989
Cimini A. and Moresi M. 2018c. Effect of brewery size on the main process parameters and cradle-to-grave carbon footprint of lager beer. J. Ind. Ecol. 22(5): 1139–1155. 10.1111/jiec.12642
Cimini A. and Moresi M. 2020. Innovative rough beer conditioning process free from diatomaceous earth and polyvinyl polypyrrolidone. Foods. 9(1228): 1–13. 10.3390/foods9091228
Climate Conservancy. 2008. The carbon footprint of Fat Tire® Amber Ale. Available at: https://www.ess.uci.edu/~sjdavis/pubs/Fat_Tire_2008.pdf (accessed 10 Aug 21).
Coelho E., Rocha M.A.M., Saraiva J.A., and Coimbra M.A. 2014. Microwave superheated water and dilute alkali extraction of brewers’ spent grain arabinoxylans and arabinoxylo-oligosaccharides. Carbohydr Polym. 99: 415–422. 10.1016/j.carbpol.2013.09.003
Cook D. 2011. Brewers’ grains: opportunities abound. Brew Guard. 140(6): 60–63.
Cooray S.T., Lee J.J.L., and Chen W.N. 2017. Evaluation of brewers' spent grain as a novel media for yeast growth. AMB Express. 7: 1–10. 10.1186/s13568-016-0313-x
Crawshaw R. 2004. Co-product feeds: animal feeds from the food and drinks industries. Nottingham University Press, Nottingham, UK.
Crescenzi A.M. 1987. Factors governing the milling of malt. J Inst Brew. 93: 193–201.
De León-González G., González-Valdez J., Mayolo-Deloisa K., and Rito-Palomares M. 2016. Intensified fractionation of brewery yeast waste for the recovery of invertase using aqueous two-phase systems. Biotechnol Appl Biochem. 63: 886–894. 10.1002/bab.1435
Dessalew G., Beyene A., Nebiyu A., and Ruelle M.L. 2017. Use of industrial diatomite wastes from beer production to improve soil fertility and cereal yields. J Clean Prod. 157: 22–29. 10.1016/j.jclepro.2017.04.116
Deutsche Welle (DW). n.d. Plastic bottle recycling champion: Norway or Germany? Available at: https://www.dw.com/en/plastic-bottle-recycling-champion-norway-or-germany/a-44880423 (accessed 07 Sep 2021).
Du L., Arauzo, P.J., Meza Zavala M.F., Cao Z., Olszewski M.P., and Kruse A. 2020. Towards the properties of different biomass-derived proteins via various extraction methods. Molecules. 25: 488. 10.3390/molecules25030488
Dudek M., Świechowski K., Manczarski P., Koziel J.A., and Białowiec A. 2019. The effect of biochar addition on the biogas production kinetics from the anaerobic digestion of brewers’ spent grain. Energies. 12: 1518. 10.3390/en12081518
Eßlinger H.M. 2009. Handbook of brewing and beer processes-technology-markets, 1st ed. Wiley-VCH Verlag GmbH, Weinheim, Germany.
Environmental Product Declaration® (EPD). 2011a. EPD® Tuborg® beer. Reg. No. S-P-00311. http://environdec.com/en/Detail/epd311 (accessed 09 Sep 2021).
Environmental Product Declaration® (EPD). 2011b. EPD® BAP Bock chiara® and BAP Bock rossa® beer. Reg. No. S-P-00314. Available at: http://www.environdec.com/en/Detail/epd314. (accessed 09 Sep 2021).
Environmental Product Declaration® (EPD). 2014a. EPD® Birrificio Angelo Poretti 5 luppoli bock chiara® and Birrificio Angelo Poretti 6 luppoli bock rossa® beer. Reg. No. S-P-00314. Available at: https://www.environdec.com/library/epd314 (accessed 13 Sep 2021).
Environmental Product Declaration® (EPD). 2014b. EPD® Kronenbourg 1664® beer. Reg. No. S-P-00533. Available at: https://www.environdec.com/library/epd533 (accessed 09 Sep 2021).
Environmental Product Declaration® (EPD). 2019. Beer made from malt. UN CPC 24310 2011:21 version 2.11. The International EPD® System. Available at: https://portal.environdec.com/api/api/v1/EPDLibrary/Files/5c9f8d42-e4cc-45b0-979e-343a5afe6b36/Data (accessed 12 Sep 2021).
European Union (EU). 2005. EU regulation No. 183/2005 of the European Parliament and the Council of 12 January 2005 laying down requirements for feed hygiene. Available at: https://www.legislation.gov.uk/eur/2005/183 (accessed 27 Aug 2021).
European Union (EU). 2008. Directive 2008/98/EC of the European Parliament and the Council of 19 November 2008 on waste and repealing certain directives. Off J Eur Union. L 312: 3–30. Available at: https://eur-lex.europa.eu/legal-content/EN/TXT/PDF/?uri=CELEX:32008L0098&from=EN (accessed 14 Aug 2021).
European Union (EU). 2018. Directive 2018/852/EU of the European Parliament and the Council of 30 May 2018 on packaging and packaging waste. Off J Eur Union. L 150: 141. Available at: https://eur-lex.europa.eu/legal-content/EN/TXT/?uri=CELEX:32018L0852 (accessed 05 Sep 2021).
EverGrain. 2021. Sustainable brewing may provide a model for a circular economy. Available at: https://grist.org/sponsored/sustainable-brewing-may-provide-a-model-for-a-circular-economy/ (accessed 26 Aug 2021).
Femi-ola T.O. and Atere V.A. 2013. Citric acid production from brewers spent grain by Aspergillus niger and Saccharomyces cerevisiae. Int J Res Biosci. 2: 30–37. Available at: http://www.ijrbs.in/index.php/ijrbs/article/view/62 (accessed 11 Dec 2021).
Ferraz E., Coroado J., Gamelas J., Silva J., Rocha F., and Velosa A. 2013. Spent brewery grains for improvement of thermal insulation of ceramic bricks. J Mater Civ Eng. 25: 1638–1646. 10.1061/(ASCE)MT.1943-5533.0000729
Ferraz E., Coroado J., Silva J., Gomes C., and Rocha F. 2011. Manufacture of ceramic bricks using recycled brewing spent Kieselguhr. Mat Manuf Proc. 26(10): 1319–1329. 10.1080/10426914.2011.551908
Ferreira A.M., Martins J., Carvalho L.H., and Magalhäes F.D. 2019. Biosourced disposable trays made of brewer’s spent grain and potato starch. Polymers, 11(5): 923. 10.3390/polym11050923
Ferreira I.M.P.L.V.O., Pinhoa O., Vieiraa E., and Tavarelaa J.G. 2010. Brewer’s saccharomyces yeast biomass: characteristics and potential applications. Trends Food Sci. Technol. 21: 77–84. 10.1016/j.tifs.2009.10.008
Fillaudeau L., Blanpain-Avet P., and Daufin G. 2006. Water, wastewater and waste management in brewing industries. J Clean Prod. 14: 463–471. 10.1016/j.jclepro.2005.01.002
Food and Agriculture Organization (FAO). 2009. Agribusiness handbook: barley, malt, beer. FAO, Rome, Italy, p. 17.
Formela K., Hejna A., Zedler Ł., Przybysz M., Ryl J., Saeb M.R., and Piszczyk Ł. 2017. Structural, thermal and physico-mechanical properties of polyurethane/brewers’ spent grain composite foams modified with ground tire rubber. Ind Crops Prod. 108: 844–852. 10.1016/J.INDCROP.2017.07.047
Garcia-Garcia G., Woolley E., and Rahimifard S. 2015. A framework for a more efficient approach to food waste management. Int J Food Eng. 1(1): 65–72. 10.18178/ijfe.1.1.65-72
Gong X., Tian W., Wang L., Bai J., Qiao K., and Zhao J. 2019. Biological regeneration of brewery spent diatomite and its reuse in basic dye and chromium (III) ions removal. Proc Safety Environ Prot. 128: 353–361. 10.1016/j.psep.2019.05.024
González-García S., Morales P.C., and Gullón B. 2018. Estimating the environmental impacts of a brewery waste-based biorefinery: bioethanol and xylooligosaccharides joint production case study. Ind Crops Prod. 123: 331–340. 10.1016/j.indcrop.2018.07.003
Gopal C. and Rehmanji M. 2000. PVPP–the route to effective beer stabilization. Brewers’ Guardian, 1–6 May 2000.
Grains Research & Development Corporation (GRDC). 2018. Barley–Section 15–marketing. GRDC Grownotes, pp. 1–6. Available at: https://grdc.com.au/__data/assets/pdf_file/0021/370542/GrowNote-Barley-North-15-Marketing.pdf (accessed 18 Sep 2021).
Grand View Research (GVR). 2021. Lactic acid market size, share & trends analysis report by raw material (sugarcane, corn, cassava), by application (PLA, food, & beverages), by region, and segment forecasts, 2021–2028. Available at: https://www.grandviewresearch.com/industry-analysis/lactic-acid-and-poly-lactic-acid-market (accessed 03 Sep 2021).
Grilla E., Vakros J., Konstantinou I., Manariotis I.D., and Mantzavinos D. 2020. Activation of persulfate by biochar from spent malt rootlets for the degradation of trimethoprim in the presence of inorganic ions. J Chem Technol Biotechnol. 95: 2348–2358. 10.1002/jctb.6513
GR-Store. 2021. Global citric acid powder industry research report 2021 segmented by major market players, types, applications and countries forecast to 2027. Available at: https://www.grandresearchstore.com/chemicals-and-materials/global-citric-acid-powder-segmented-by-major-2021-2027-640 (accessed 03 Sep 2021).
Gupta M., Abu-Ghannam N., and Gallaghar E. 2010. Barley for brewing: characteristic changes during malting, brewing and applications of its by-products. Compreh Rev Food Sci Food Safety. 9: 318–328. 10.1111/j.1541-4337.2010.00112.x
Hejna A., Barczewski M., Skórczewska K., Szulc J., Chmielnicki B., Korol J., and Formela K. 2021. Sustainable upcycling of brewers’ spent grain by thermo-mechanical treatment in twin-screw extruder. J Clean Prod. 25: 124839. 10.1016/j.jclepro.2020.124839
Holland D. 2021. The history, production process of beer & how circular principles can be applied. Available at: https://www.hogeschoolrotterdam.nl/contentassets/bbc0c6d639834a3b90f782801c35b25b/circular-economy-and-the-brewing-industry_dirkholland_0902913.pdf (accessed 29 Jul 2021).
Hospido A., Moreira M.T., and Feijoo G. 2005. Environmental analysis of beer production. Int J Agr Res Govern Ecol. 4(2): 152–162. 10.1504/IJARGE.2005.007197
Huige N.J. 2006. Brewery by-products and effluents. In: Priest F.G. and Stewart G.G. (eds.), Handbook of brewing, 2nd ed. Taylor & Francis, Boca Raton, FL, USA, pp. 656–707.
Huijbregts M.A.J., Hellweg S., Frischknecht R., Hendriks H.W.M., Hungerbühler K., and Hendriks A.J. 2010. Cumulative energy demand as predictor for the environmental burden of commodity production. Environ Sci Technol. 44(6): 2189–2196. 10.1021/es902870s
Huijbregts M.A.J., Rombouts L.J.A., Hellweg S., Frischknecht R., Hendriks A.J., van de Meent D., Ragas A.M.J., Reijnders L., and Struijs J. 2006. Is cumulative fossil energy demand a useful indicator for the environmental performance of products? Environ Sci Technol. 40(3): 641–648. 10.1021/es051689g
IMARC Group. 2021. Beer market: global industry trends, share, size, growth, opportunity and forecast 2021–2026. Available at: https://www.imarcgroup.com/beer-market (accessed 30 July 2021).
Intergovernmental Panel on Climate Change (IPCC). 2014. Summary for policymakers. In: Field C.B., Barros V.R., Dokken D.J., Mach K.J., Mastrandrea M.D., Bilir T.E., Chatterjee M., Ebi K.L, Estrada Y.O., Genova R.C., Girma B., Kissel E.S, Levy A.N., MacCracken S., Mastrandrea P.R. and White L.L. (Eds.), Climate change 2014: impacts, adaptation, and vulnerability. Part A: Global and sectoral aspects. Contribution of Working Group II to the Fifth Assessment Report of the Intergovernmental Panel on Climate Change. Cambridge University Press, Cambridge, UK, pp. 1–32.
International Finance Corporation (IFC). 2007. Environmental, health, and safety guidelines for breweries. Available at: https://www.ifc.org/wps/wcm/connect/8afeb6b7-6602-4394-8584-7643035eeb50/Final%2B-%2BBreweries.pdf?MOD=AJPERES&CVID=jqeI3sW (accessed 11 Aug 2020).
Jackowski M., Niedźwiecki Ł., Jagiełło K., Uchańska O., and Trusek A. 2020. Brewer’s spent grains–valuable beer industry by-product. Biomolecules. 10: 1669. 10.3390/biom10121669
Jackowski M., Semba D., Trusek A., Wnukowsk, M., Niedzwiecki L., Baranowski M., Krochmalny K., and Pawlak-Kruczek H. 2019. Hydrothermal carbonization of brewery’s spent grains for the production of solid biofuels. Beverages. 5: 12. 10.3390/beverages5010012
Kan X., Zhang J., Wah Y., and Wang C. 2018. Overall evaluation of microwave-assisted alkali pretreatment for enhancement of biomethane production from brewers’ spent grain. Energy Convers Manag. 158: 315–326. 10.1016/j.enconman.2017.12.088
Karlović A., Jurić A., Ćorić N., Habschied K., Krstanović V., and Mastanjević K. 2020. By-products in the malting and brewing industries–re-usage possibilities. Fermentation, 6: 82. 10.3390/fermentation6030082
Kerby C. and Vriesekoop F. 2017. An overview of the utilisation of brewery by-products as generated by British craft breweries. Beverages. 2017(3): 24. 10.3390/beverages3020024
Kim H.-W., Hwang K.-E., Song D.-H., Lee S.-Y., Choi M.-S., Lim Y.-B., Choi J.-H., Choi Y.-S., Kim H.-Y., and Kim C.-J. 2013. Effects of dietary fiber extracts from brewer's spent grain on quality characteristics of chicken patties cooked in convective oven. Korean J Food Sci An. 33(1): 45–52. 10.5851/kosfa.2013.33.1.45
Kirjoranta S., Tenkanen M., and Jouppila K. 2016. Effects of process parameters on the properties of barley containing snacks enriched with brewer’s spent grain. J Food Sci Technol. 53: 775–783. 10.1007/s13197-015-2079-6
Kissell L., Prentice N., and Lindsay R. 1979. Protein and fiber enrichment of cookie flour with brewer's spent grain. Cereal Chem. 56: 261–266.
Koroneos C., Roumbas G., Gabari Z., Papagiannidou E., and Moussiopoulos N. 2005. Life cycle assessment of beer production in Greece. J Clean Prod. 13(4): 433–439. 10.1016/j.jclepro.2003.09.010
Ktenioudaki A., Chaurin V., Reis S.F., and Gallagher E. 2012. Brewer's spent grain as a functional ingredient for breadsticks. Int J Food Sci Technol. 47: 1765–1771. 10.1111/j.1365-2621.2012.03032.x
Ktenioudaki A., Crofton E., Scannell A.G.M., Hannon J.A., Kilcawley K.N., and Gallagher E. 2013. Sensory properties and aromatic composition of baked snacks containing brewer’s spent grain. J Cereal Sci. 57: 384–390. 10.1016/j.jcs.2013.01.009
Kusch-Brandt S., Mumme J., Nashalian O., Girotto F., Lavagnolo M.C., and Udenigwe C. 2019. Valorization of residues from beverage production. In: Grumezescu A., Holban A. M. (eds.), Processing and sustainability of beverages, Chap. 13. Elsevier, Philadelphia, PA, USA, pp. 451–494.
Laitila A., Saarela M., Kirk L., Siika-Aho M., Haikara A., Mattila-Sandholm T., and Virkajärvi I. 2004. Malt sprout extract medium for cultivation of Lactobacillus plantarum protective cultures. Lett Appl Microbiol. 39: 336–340. 10.1111/j.1472-765X.2004.01579.x
Li Q., Qi Y. and Gao C. 2015. Chemical regeneration of spent powdered activated carbon used in decolorization of sodium salicylate for the pharmaceutical industry. J Clean Prod. 86: 424–431. 10.1016/j.jclepro.2014.08.008
Mahmud S.A., Hirasawa T., and Shimizu H. 2010. Differential importance of trehalose accumulation in Saccharomyces cerevisiae in response to various environmental stresses. J Biosci Bioengin. 109: 262–266. 10.1016/j.jbiosc.2009.08.500
Mancini S., Fratini F., Turchi B., Mattioli S., Dal Bosco A., Tuccinardi T., Nozic S., and Paci G. 2019. Former foodstuff products in Tenebrio molitor rearing: effects on growth, chemical composition, microbiological load, and antioxidant status. Animals. 9: 484. 10.3390/ani9080484
Mariotta C. and Tuscano J. 2020. Imballaggi e rifiuti di imballaggio. In: Rapporto rifiuti urbani – edizione 2020, Chap. 4. ISPRA Rapporti 331/2020. Istituto Superiore per la Protezione e la Ricerca Ambientale, Roma, pp. 177–205. Available at: https://www.isprambiente.gov.it/files2020/pubblicazioni/rapporti/rapportorifiutiurbani_ed-2020_n-331-1.pdf (accessed 5 Sep 2021).
Mata T.M. and Costa C.A.V. 2001. Life cycle assessment of different reuse percentages for glass beer bottles. Int J Life Cycle Assessm. 6(5): 307–319. 10.1007/BF02978793
Metzger B.T., Scholl C. and Barnes D.M. 2012. Supercritical fluid extraction of vitamin D2 from UV enhanced yeast. FASEB J. 26(Supl 1): 643.11. 10.1096/fasebj.26.1_supplement.643.11
Mishra P.K., Gregor T. and Wimmer R. 2017. Utilising brewer’s spent grain as a source of cellulose nanofibres following separation of protein-based biomass. Bioresources. 12(1): 107–116. 10.15376/biores.12.1.107–116
Moresi M. and Parente E. 1999. Production of organic acids. In: Robinson R. K., Batt C. A., Patel P.D. (eds.), Encyclopedia of food microbiology. Academic Press, New York, NY, pp. 705–717.
Muñoz E., Riquelme C., and Cardenas J. P. 2012. Carbon footprint of beer – analysis of a small scale processing plant in Chile. In: Proceedings of the 2nd LCA conference, 6–7 November 2012, Lille, France.
Mussatto S.I. 2009. Biotechnological potential of brewing industry by-products. In: Singh nee’ Nigam P. and Pandey A. (eds.), Biotechnology for agro-industrial residues utilisation: utilisation of agro-residues, Chap. 16. Springer Science, Berlin, Germany, pp. 313–326.
Mussatto S.I., Fernandes M., Rocha G.J.M., Órfão J.J.M., Teixeira J.A., and Roberto I.C. 2010. Production, characterization and application of activated carbon from brewer’s spent grain lignin. Bioresour Technol. 101: 2450–2457. 10.1016/j.biortech.2009.11.025
Mussatto S.I. and Roberto I.C. 2008. Establishment of the optimum initial xylose concentration and nutritional supplementation of brewer's spent grain hydrolysate for xylitol production by Candida guilliermondii. Process Biochem. 43: 540–546. 10.1016/j.procbio.2008.01.013
Mycoterra Farm. 2015. Cultivation of gourmet mushrooms using brewer’s spent grain. Final Report for FNE14-795. Available at: https://projects.sare.org/project-reports/fne14-795/ (accessed 30 Jul 2021).
Nagy M., Semeniuc C.A., Socaci S.A., Pop C.A., Rotar A.M., Salagean C.D., and Tofana M. 2017. Utilization of brewer's spent grain and mushrooms in fortification of smoked sausages. Food Sci Technol. 37: 315–320. 10.1590/1678-457x.23816
Narayanaswamy V., Van Berkel R., Altham J., and McGregor M. 2005. Application of life cycle assessment to enhance eco-efficiency of grains supply chains. In: Proceedings of the 4th Australian LCA Conference, 23–25 February, 2005, Sydney, NSW, Australia.
Nazzaro J., Martin D.S., Perez-Vendrell A.M., Padrell L., Iñarra B., Orive M., and Estévez A. 2021. Apparent digestibility coefficients of brewer’s by-products used in feeds for rainbow trout (Oncorhynchus mykiss) and gilthead seabream (Sparus aurata). Aquaculture. 530: 735796. 10.1016/j.aquaculture.2020.735796
Neylon E., Arendt E.K., Lynch K.M., Zannini E., Bazzoli P., Monin T., and Sahin A.W. 2020. Rootlets, a malting by-product with great potential. Fermentation. 6: 117. 10.3390/fermentation6040117ć
Nocente F., Taddei F., Galassi E., and Gazza L. 2019. Upcycling of brewers’ spent grain by production of dry pasta with higher nutritional potential. Food Sci. Technol (LWT). 114: 108421. 10.1016/j.lwt.2019.108421
Normand J., Battista K., Bobier J., Schritt C., and Antony S. 2012. Life cycle assessment of beer. Available at: https://prezi.com/idfmkerh9vrt/life-cycle-assessment-of-beer/ (accessed 12 Sep 2021).
Nsoanya L.N and Nweke I.A. 2015. Effect of integrated use of spent grain and NPK (20:10:10) fertilizer on soil chemical properties and maize (Zea Mays L) growth. Int J Res Agr Forest. 2(3): 14–19.
Olajire A.A. 2020. The brewing industry and environmental challenges. J Clean Prod. 256: 102817. 10.1016/j.jclepro.2012.03.003
Özvural E.B., Vural H., Gökbulut I., and Özboy-Özbaş Ö. 2009. Utilization of brewer’s spent grain in the production of Frankfurters. Int J Food Sci Technol. 44: 1093–1099. 10.1111/j.1365-2621.2009.01921.x
Paládi M. 2013. Comparison of CO2 emissions of households heated by natural gas and firewood. Landscape Environ. 7(2): 64–72.
Pauli G. 1997. Zero emissions: the ultimate goal of cleaner production. J Clean Prod. 5(1–2): 109–113. 10.1016/S0959-6526(97)00013-9
Paynter B. 1996. Grain protein and malting quality in barley. Farmnote No. 40. Agriculture Western Australia. Available at: https://www.researchgate.net/publication/274077552_Grain_protein_and_malting_quality_in_barley (accessed 18 Sep 2021).
Petrovic J., Pajin B., Tanackov-Kocic S., Pejin J., Fistes A., Bojanic N., and Loncarevic I. 2017. Quality properties of cookies supplemented with fresh brewer’s spent grain. Food Feed Res. 44: 57–63.
Podpora B., Swiderski F., Sadowska A., Rakovska R., and Wasiak-Zys G. 2016. Spent brewer's yeast extracts as a new component of functional food. Czech J Food Sci. 34: 554–563. 10.17221/419/2015-CJFS
Qin F., Johansen A.Z., and Mussatto S.I. 2018. Evaluation of different pretreatment strategies for protein extraction from brewer’s spent grains. Ind Crops Prod. 125: 443–453. 10.1016/j.indcrop.2018.09.017
Qiu L., Li J.-J., Li Z. and Wang J.-J. 2019. Production and characterization of biocontrol fertilizer from brewer’s spent grain via solid-state fermentation. Sci Rep. 9: 480. 10.1038/s41598-018-36949-1
Rachwał K., Waško A., Gustaw K. and Polak-Berecka M. 2020. Utilization of brewery wastes in food industry. Peer J. 8: e9427. 10.7717/peerj.9427
Radosavljević M., Pejin J., Pribić M., Kocić-Tanackov S., Mladenović D., Djukić-Vuković A., and Mojović L. 2020. Brewing and malting technology by-products as raw materials in L-(+)-lactic acid fermentation. J Chem Technol Biotechnol. 95: 339–347. 10.1002/jctb.5878
Reis S.F., Coelho E., Coimbra M.A. and Abu-Ghannam N. 2015. Improved efficiency of brewer’s spent grain arabinoxylans by ultrasound-assisted extraction. Ultrason Sonochem. 24: 155–164. 10.1016/j.ultsonch.2014.10.010
Rogissart L., Foucherot C. and Bellassen V. 2019. Estimating greenhouse gas emissions from food consumption: methods and results. I4CE. Institute for Climate Economics, Paris, France.
Rommi K., Niemi P., Kemppainen K., and Kruus K. 2018. Impact of thermochemical pre-treatment and carbohydrate and protein hydrolyzing enzyme treatment on fractionation of protein and lignin from brewer’s spent grain. J Cereal Sci. 79: 168–173. 10.1016/j.jcs.2017.10.005
Russ W., Mörtel H., and Meyer-Pittroff R. 2005. Application of spent grains to increase porosity in bricks. Constr Build Mater. 19: 117–126. 10.1016/j.conbuildmat.2004.05.014
Saenge C., Cheirsilp B., Suksaroge T.T., and Bourtoom T. 2011. Potential use of oleaginous red yeast Rhodotorula glutinis for the bioconversion of crude glycerol from biodiesel plant to lipids and carotenoids. Process Biochem. 46: 210–218. 10.1016/j.procbio.2010.08.009
Sakaguchi K., Kibi M., and Kuminaka A. 1963. Process for improving the flavour of foods by the addition of 5’nucleotides. US patent No. 3104171A, 17 Sep 1963.
Sakaguchi K. andKuninaka A. 1965. Production of 5’nucleotides. US patent No. 3223592A, 14 Dec 1965.
Sala S., Cerutti A.K., and Pant R. 2018. Development of a weighting approach for the environmental footprint. Publications Office, European Union, Luxembourg. Available at: https://ec.europa.eu/environment/eussd/smgp/documents/2018_JRC_Weighting_EF.pdf. (accessed 19 Sep 2021).
Sganzerla W.G., Ampese L.C., Mussatto S.I., and Forster-Carneiro T. 2021. A bibliometric analysis on potential uses of brewer’s spent grains in a biorefinery for the circular economy transition of the beer industry. Biofuels Bioprod Biorefining., 15(6): 1965–1988. 10.1002/bbb.2290
Shin R. and Searcy C. 2018. Evaluating the greenhouse gas emissions in the craft beer industry: an assessment of challenges and benefits of greenhouse gas accounting. Sustainability. 10(11): 4191. 10.3390/su10114191
Siebert K.J., Carrasco A. and Lynn P.Y. 1996. Formation of protein-polyphenol haze in beverages. J Agr Food Chem. 44: 1997–2005. 10.1021/jf950716r
Singh R. and Saini G. 2012. Biosynthesis of pullulan and its applications in food and pharmaceutical industry. In: Satyanarayana T., Johri B., Prakash A. (Eds.), Microorganisms in sustainable agriculture and biotechnology. Springer, Dordrecht, the Netherlands, pp. 509–553.
Sombutyanuchit P., Suphantharika M., and Verduyn C. 2001. Preparation of 50-GMP-rich yeast extracts from spent brewer’s yeast. World J. Microbiol Biotechnol. 17: 163–168.
Sperandio G., Amoriello T., Carbone K., Fedrizzi M., Monteleone A., Tarangioli S., and Pagano M. 2017. Increasing the value of spent grain from craft microbreweries for energy purposes. Chem Eng Trans. 58: 487–492.
Spinelli S., Conte A., and Del Nobile M.A. 2016. Microencapsulation of extracted bioactive compounds from brewer's spent grain to enrich fish-burgers. Food Bioprod Process. 100: 450–456. 10.1016/j.fbp.2016.09.005
Statista. 2021. Beer production worldwide from 1998 to 2019. Available at: https://www.statista.com/statistics/270275/worldwide-beer-production/ (accessed 05 Aug 2021).
Stefanello F.S., Dos Santos C.O., Bochi V.C., Fruet A.P.B., Soquetta M.B., Dörr A.C, and Nörnberg J.L. 2018. Analysis of polyphenols in brewer's spent grain and its comparison with corn silage and cereal brans commonly used for animal nutrition. Food Chem. 239: 385–401. 10.1016/j.foodchem.2017.06.130
Steinmacher N.C., Honna F.A., Gasparetto A.V., Anibal D., and Grossmann M.V.E. 2012. Bioconversion of brewer’s spent grains by reactive extrusion and their application in bread-making. Food Sci Technol (LWT). 46: 542–547. 10.1016/j.lwt.2011.11.011
Stojceska V., Ainsworth P., Plunkett A., and Ibanoglu S. 2008. The recycling of brewer’s processing by-product into ready-to-eat snacks using extrusion technology. J Cereal Sci. 47: 469–479. 10.1016/j.jcs.2007.05.016
Stubits M., Teng J., and Pereira J. 1986. Characterization of malt grist fractions. Am Soc Brew Chem J. 44(1): 12–15. 10.1094/ASBCJ-44-0012
Sturm B., Butcher M., Wang Y., Huang Y., and Roskilly T. 2012. The feasibility of the sustainable energy supply from bio wastes for a small-scale brewery–a case study. ApplTherm Eng. 39: 45–52. 10.1016/j.applthermaleng.2012.01.036
Sturm B., Hugenschmidt S., Joyce S., Hofacker W., and Roskilly A.P. 2013. Opportunities and barriers for efficient energy use in a medium-sized brewery. Appl Therm Eng. 53: 397–404. 10.1016/j.applthermaleng.2012.05.006
Talve S. 2001. Life cycle assessment of a basic lager beer. Int J Life Cycle Assessm. 6(5): 293–298. 10.1007/BF02978791
Tan Y.X., Mok W.K., and Chen W.N. 2020. Potential novel nutritional beverage using submerged fermentation with Bacillus subtilis WX-17 on brewers’ spent grains. Heliyon. 6: e04155. 10.1016/j.heliyon.2020.e04155.
Technical Secretariat for the Beer Pilot (TSBP). 2016. Product environmental footprint category rules for beer. Draft version 2.5, 17 March 2016. Available at: https://webgate.ec.europa.eu/fpfis/wikis/display/EUENVFP/Stakeholder+workspace%3A+PEFCR+pilot+Beer (accessed 12 Sep 2021).
Thammakiti S., Suphantharika M., Phaesuwan T., and Verduyn C. 2004. Preparation of spent brewer’s yeast β-glucans for potential applications in the food industry. Int J. Food Sci Tech. 39: 21–29. 10.1111/j.1365-2621.2004.00742.x
The Maltsters Association of Great Britain (MAGB). n.d. Malting co-products. Valuable nutritional ingredients for the feed industry. Available at: https://www.ukmalt.com/technical/8-food-and-feed-safety/malting-co-products/ (accessed 22 Aug 2021).
Tsavatopoulou V.D., Vakros J., and Manariotis I.D. 2020. Lipid conversion of Scenedesmus rubescens biomass into biodiesel using biochar catalysts from malt spent rootlets. J Chem Technol Biotechnol. 95: 2421–2429. 10.1002/jctb.6424
United Nations Environment Program (UNEP). 1996. Environmental management in the brewing industry. Technical report series No. 33. UNEP, Paris, France.
Vieira E.F., Carvalho J., Pinto E., Cunha S., Almeida A.A., Ferreira I.M.P.L.V.O. 2016. Nutritive value, antioxidant activity and phenolic compounds profile of brewer's spent yeast extract. J Food Comp Analy. 52: 44–51.
Vieira E., Rocha M.A.M., Coelho E., Pinho O., Saraiva J.A., Ferreira I.M.P.L.V.O., and Coimbra M.A. 2014. Valuation of brewer’s spent grain using a fully recyclable integrated process for extraction of proteins and arabinoxylans. Ind Crops Prod. 52: 136–143. 10.1016/j.indcrop.2013.10.012
Vitanza R., Cortesi A., Gallo V., Colussi, I., and De Arana-Sarabia M.E. 2016. Biovalorization of brewery waste by applying anaerobic digestion. Chem Biochem Eng. Q. 30: 351–357. 10.15255/CABEQ.2015.2237
Wang H., Tao Y., Temudo M., Schooneveld M., Bijl H., Ren N., Wolf M., Heine C., Foerster A., Pelenc V., Kloek J., and van Lier J.B. 2015. An integrated approach for efficient biomethane production from solid bio-wastes in a compact system. Biotechnol Biofuels. 8: 62. https://biotechnologyforbiofuels.biomedcentral.com/articles/ 10.1186/s13068-015-0237-8.
Waters D.M., Kingston W., Jacob F., Titze J., Arendt E.K., and Zannini E. 2013. Wheat bread biofortification with rootlets, a malting by-product. J Sci Food Agric. 93: 2372–2383. 10.1002/jsfa.6059
Watson J. 2008. Draught beer beats bottled in life cycle assessment. Available at: http://www.treehugger.com/clean-technology/draught-beer-beats-bottled-in-life-cycle-assessment.html (accessed 28 Aug 2016).
White J.S., Yohannan B.K., and Walker G.M. 2008. Bioconversion of brewer’s spent grains to bioethanol. FEMS Yeast Res. 8: 1175–1184. 10.1111/j.1567-1364.2008.00390.x
Wikipedia. 2021. Marmite. Available at: https://en.wikipedia.org/wiki/Marmite (accessed 25 Aug 2021).
Wilkinson S., Smart K.A., James S., and Cook D.J. 2017. Bioethanol production from brewers spent grains using a fungal consolidated bioprocessing (CBP) approach. Bioenergy Res. 10: 146–157. 10.1007/s12155-016-9782-7
Williams A.G. and Mekonen S. 2014. Environmental performance of traditional beer production in a micro-brewery. In: Schenck R., Huizenga D. (eds.), Proceedings of the 9th International Conference on Life Cycle Assessment in the Agri-food Sector, San Francisco, CA, USA, 8–10 October 2014. American Center for Life Cycle Assessment (ACLCA), Vashon, WA, USA, pp. 1535–1540. Available at: http://lcafood2014.org/papers/271.pdf (accessed 28 Aug 2016).
Worrasinchai S., Suphantharika, M., Pinjai S., and Jamnong P. 2006. β-glucan prepared from spent brewer’s yeast as a fat replacer in mayonnaise. Food Hydrocoll. 20: 68–78. 10.1016/j.foodhyd.2005.03.005
Xiros C., Topakas E., Katapodis P., and Christakopoulos P. 2008. Evaluation of Fusarium oxysporum as an enzyme factory for the hydrolysis of brewer’s spent grain with improved biodegradability for ethanol production. Ind Crops Prod. 28: 213–224. 10.1016/j.indcrop.2008.02.004
Yamaguchi S. 1998. Basic properties of umami and its effects on food flavor. Food Rev Int. 14: 139–176. 10.1080/87559129809541156
Yu D., Sun Y., Wang W., O’Keefe S.F., Neilson A.P., Feng H., Wang Z., and Huang H. 2020. Recovery of protein hydrolysates from brewer’s spent grain using enzyme and ultrasonication. Int J Food Sci Technol. 55: 357–368. 10.1111/ijfs.14314
Zalynthios G. and Varzakas T. 2016. Carotenoids: from plants to food industry. Curr Res Nutr Food Sci. 4: 38–51. 10.12944/CRNFSJ.4.Special-Issue1.04
Zürcher C. and Gruss R. 1990. Method of making alcohol-free or nearly alcohol-free beer. US patent No. 5077061, 21 December 1990.