
Download
R S A % = A D P P H − A s a m p l e A D P P H × 100 % A c i d = V o f u s e d N a O H 0.1 M N a O H 0.064 m i l i e q u i v a l e n t f a c t o r 100 g r a m s o f s a m p l e 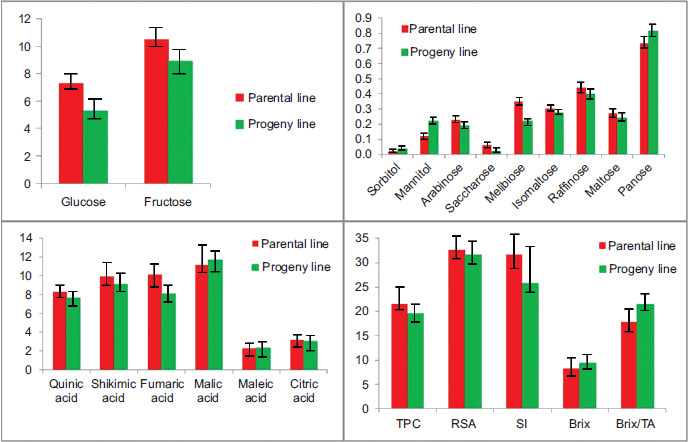
RESEARCH ARTICLE
New promising strawberry cultivars with improved sugar and organic acid profiles and favorable sensory properties
Nevena N. Momirović1, Mihajlo V. Jakanovski2*, Aleksandra M. Dramićanin3, Mirjana D. Mosić3, Dragan T. Nikolić1, Nebojša M. Momirović1, Dušanka M. Milojković-Opsenica3
1University of Belgrade, Faculty of Agriculture, Belgrade-Zemun, Serbia;
2University of Belgrade, Faculty of Pharmacy, Belgrade, Serbia;
3Department of Analytical Chemistry and Center of Excellence for Molecular Food Sciences, Faculty of Chemistry, University of Belgrade, Belgrade, Serbia
Abstract
This study evaluated 24 strawberry genotypes, including 12 parental varieties and 12 progenies, using chemical and sensory analyses to assess fruit quality and panelist preferences. Sugar and organic acid profiles, total -soluble solids, titratable acidity, phenolic content, radical-scavenging activity, and sweetness index were determined. Statistical analyses examined correlations among quality parameters, focusing on the influence of sugars and acids on the Brix/TA ratio. Sensory evaluation confirmed panelists’ perception of sweetness and sourness differences. Progeny cultivars BL34 Sandra, BL29 Nadja, and BL42 Federica showed superior quality; two were registered as new varieties, while one is under registration.
Key words: Breeding and selection, Chemical and sensory analyses, Fruit quality parameters, Parental genotypes, Progenies genotypes, Strawberry
*Corresponding Author: Mihajlo V Jakanovski, University of Belgrade, Faculty of Pharmacy, Belgrade, Serbia. Email: jakanovski@chem.bg.ac.rs
Academic Editor: Prof. Giuseppina Parpinello, University of Bologna, Italy
Received: 24 September 2025; Accepted: 9 March 2026; Published: 17 April 2026
© 2026 Codon Publications
This is an Open Access article distributed under the terms of the Creative Commons Attribution-NonCommercial-ShareAlike 4.0 International (CC BY-NC-SA 4.0). License (http://creativecommons.org/licenses/by-nc-sa/4.0/)
Introduction
Strawberry (Fragaria x annanassa Duch.) is one of the most commercially grown berry fruits with more than 9 million tons produced globally (according to FAOSTAT data for 2021). In an abundance of numerous different strawberry varieties grown worldwide, and in accordance with the increased demand for high-quality fruit, the directions of cultivation and selection of strawberry have changed and today they are moderated toward obtaining fruits of superior quality that will be widely accepted by consumers (Mazzoni et al., 2020). Parameters that affect fruit quality are taste, aroma, the ratio between sugar and acidity (S/A), attractiveness/appearance, color, and shine. Taste is cultivar-dependent and one of the most important characteristics of strawberry fruit. It is mostly influenced by the total soluble solids (Brix) and titratable acidity (TA) in fruits (Resende et al., 2008). Brix mostly consists of glucose, fructose, and sucrose, whereas TA mainly consists of the primary organic acids in strawberry, citric and malic acids. Despite having a lower abundance than sugars, organic acids have a higher effect on taste because they make food more sour, which makes it harder to perceive sweetness (Ikegaya et al., 2019). As a result, a common method for determining -strawberry sweetness is the Brix/TA ratio (Sone et al., 2000). Aroma derives from different volatile organic compounds (VOCs) such as esters, alcohols, ketones, furans, terpenes, aldehydes, and sulfurous compounds which add up to a complex and distinctive strawberry profile (Padilla-Jiménez et al., 2021). Besides that, the quality of the fruit is also affected by fruit firmness which is mainly controlled by genotype (Fan et al., 2021). On the other hand, firmness strongly influences the fruit shelf-life and its transportability to distant markets—a key important factor for overall fruit marketability.
Previous studies have investigated the chemical composition and sensory attributes of strawberry fruits, focusing on parameters such as sugar content, organic acids, Brix/TA ratio, aroma compounds, and firmness (Ikegaya et al., 2019; Padilla-Jiménez et al., 2021; Mazzoni et al., 2020; Milosavljević et al., 2023; Resende et al., 2008). These studies have provided valuable insights into the factors influencing taste and overall fruit quality. However, many of them have been limited to a small number of genotypes or examined only a subset of sugars and organic acids, often without integrating comprehensive chemical profiling with sensory evaluation. As a result, there remains a need for studies that assess a broader range of metabolites in multiple genotypes and link these chemical parameters with sensory perception in a systematic manner. In addition, comparative studies that simultaneously include parental cultivars and their progeny remain scarce, despite their importance for understanding the inheritance of quality-related traits (Mazzoni et al., 2020; Milosavljević et al., 2023).
In this context, the present study provides a comprehensive analysis of 24 strawberry genotypes, including both parental varieties and their progeny, by integrating detailed chemical profiling of sugars and organic acids with selected sensory quality attributes. This integrated approach allows a systematic evaluation of the chemical determinants of strawberry taste, supports the selection of superior genotypes in breeding programs aimed at improving fruit quality, and offers a framework for future research on genotype selection and enhancement of commercially relevant cultivars.
Materials and Methods
Reagents and materials
Sugar standards (glucose, fructose, sucrose, arabinose, melibiose, isomaltose, raffinose, maltose, and panose), polyols (sorbitol and mannitol), and organic acids -(quinic, shikimic, fumaric, malic, maleic, and citric acid) were purchased from Supelco/Sigma-Aldrich (St. Louis, Missouri, United States), whereas sodium acetate -trihydrate, solid potassium hydroxide pellets, and 50% sodium hydroxide solution were obtained from Sigma-Aldrich (St. Louis). Sodium hydroxide standard solution (0.1 mol/L–1000 mL, Titrisol) ampule, Folin–Ciocalteu reagent (sodium tungstate and phosphomolybdic acid), DPPH reagent (2,2-diphenyl-1-picrylhydrazyl), and galic acid standard were delivered by Merck (Darmstadt, Germany). All solvents and chemicals were of analytical purity grade. All aqueous solutions were prepared using ultrapure water (0.055 µS/cm) obtained by using the Thermo Fisher TKA MicroPure water purification system.
Sample collection and preparation
The trial consisted of 24 strawberry genotypes in total, whereas there were 12 strawberry parental varieties and their 12 perspective candidates—progenies that originated from crossings (hybridization) of the parental varieties (Table 1). The investigation was supported by breeding consortium BerryLAB from Cesena, Italy, and company Zeleni hit d.o.o. from Belgrade, Serbia.
Table 1 Parental (1–12) and perspective progeny (13–24) lines.
| Genotype No. | Genotype name | Genotype No. | Genotype name |
|---|---|---|---|
| 1 | Favette | 13 | Ter 122.2 |
| 2 | Alba | 14 | Ter 91.16 |
| 3 | Asia | 15 | BL 34 Sandra |
| 4 | Roxana | 16 | BL 29 Nadja |
| 5 | Monterey | 17 | AR.Nº5 |
| 6 | Portola | 18 | AR.Nº10 |
| 7 | Clery | 19 | AR.Nº26 |
| 8 | Pir 5 | 20 | A.5.2 |
| 9 | Dely | 21 | BL 42 Federica |
| 10 | Eva | 22 | 11.22.8 |
| 11 | Syria | 23 | RZ.16.9 |
| 12 | San Andreas | 24 | 11.95.15 |
All genotypes were grown at the same plantation, located at the demo field of Zeleni hit company, in Belgrade, Serbia (44◦53′09′′ N, 20◦20′52′′ E, 83 m a.s.l); the region is characterized by temperate continental climate and mean annual air temperature of 14.3ºC and mean annual precipitation of 697.7 mm for the investigated period (2021). The plants were cultivated in open field conditions, in chernozem soil, within a random block design system and 4 repetition blocks, each consisting of all 24 genotypes. Each repetition block had 20 plants per genotype. The strawberry crop was planted in July 2020 from cold-stored plant material, on raised double beds with a plant density of 44000 plants/ha. The number of strawberries per plant varied depending on the genotype and plant; for each repetition block, fruits were collected separately and kept as independent biological replicates, with samples randomly selected for subsequent analyses. A regular drip-irrigation system was applied with two laterals at a 30 cm distance and standard fertilization. Before crop plantation, a significant amount of organic matter was incorporated into the soil to decrease the soil pH. In the first year after planting (May 2021), strawberry samples were collected at the full ripeness stage, defined as fruits exhibiting uniform red surface coloration covering more than 90% of the fruit surface, fully developed cultivar-specific shape, and average fruit mass of 20–25 g. When these maturity criteria were fulfilled, fruit firmness was considered optimal, corresponding to a firm but elastic texture typical of commercially ripe strawberries (Kafkas et al., 2007; Zhou et al., 2026). Samples were stored -frozen at −17 °C until further laboratory analysis.
Determination of total phenolic content (TPC)
Folin–Ciocalteu spectrophotometric assay (Natić et al., 2024) was used for the determination of TPC for all strawberry extracts. The extracts were prepared following the extraction procedure described by Natić et al. (2024). Briefly, 0.5 mL of the extracts and 0.5 mL of ultrapure water were mixed with 2.5 mL of Folin–Ciocalteu reagent (10% w/v). The mixture was incubated at room temperature, and after 5 minutes, 2 mL of 7.5% sodium carbonate solution was added. The incubation was performed at room temperature for 2 hours. After incubation, absorbance was measured at 765 nm on a GBC UV-visible Cintra 6 spectrophotometer (Dandenong, VIC, Australia). Gallic acid in the 20–120 mg/L range was used as a standard. A mixture of reagents and ultrapure water was used as blank. The results were expressed as milligrams of gallic acid equivalents per gram of dried sample (mg GAE/g).
Determination of radical-scavenging activity (RSA)
In order to assess the antioxidant properties of the strawberry plant, a DPPH RSA test was performed (Fotirić Akšić et al., 2022). Briefly, 0.1 mL of the extracts was mixed with 4 mL of methanol DPPH solution. This mixture was then incubated in the dark for 1 hour at room temperature. Absorbance was measured at 517 nm after incubation. Trolox was used as standard in the range of 100–600 μmol/L. RSA was calculated as a percentage of DPPH discoloration, where ADPPH is the absorbance of the methanol solution of DPPH, and Asample is the absorbance of samples. A mixture of 0.1 mL of methanol and 4 mL of DPPH solution was used as a blank (SP).
Brix degrees measurement (ºBx)
Soluble solids concentration, generally expressed in ºBrix units (Jayasena and Cameron, 2008), reflects the concentration of soluble solids, mostly sugars—glucose, fructose, and sucrose, the main sugars in strawberry (Ikegaya et al., 2019). In this work, fresh strawberry samples were harvested in the full ripeness stage, then cut and their juice was directly squeezed on the refractometer. Soluble solids’ concentration was measured using Hanna Instruments refractometer (Inc. HI96801).
Sugar profile
Approximately 0.5 g of dried and ground strawberry sample was extracted with 10 mL ultrapure water for an hour (2 × 30 minutes). For glucose, fructose, and sucrose readings, dilution was made 200 times fold, while for other saccharides, the extract was diluted 20 times fold, whereas injection volume was 25 µL.
A high-performance anion-exchange liquid chromatography system with pulsed amperometric detection was used to analyze sugars and sugar alcohols (polyols). Chromatographic measurement was performed using the Dionex ICS 3000 DP LC system (Dionex, Thermo Fisher Scientific, USA), equipped with a quaternary gradient pump and electrochemical detector, which consisted of Au as the working electrode and Ag/AgCl as reference electrode, autosampler (AS-DV) and Chromeleon software (Chromeleon 6.7 Chromatography Management Software). All separations were performed on the CarboPac PA100 column (4 × 250 mm (analytical) and 4 × 50 mm (guard); Dionex) thermostated to 30ºC. The mobile phase consisted of (A) 300 mmol/L NaOH and (B) 500 mmol/L NaOAc. The gradient program at flow rate of 0.7 mL/min was as follows: 0–5 minutes 15% A, 5–12 minutes 15% A and 2% B, 12–20 minutes 15% A and 4% B, 20–30 minutes 20% A and 20% B, whereas the rest to 100% was always ultrapure water (Horvacki et al., 2025). Analysis was finished within a 30-minute run time.
Sweetness index (SI)
Acceptability of horticultural products is commonly measured by the SI (Magwaza and Opara 2015), which is based on the proportion of individual sugars present within a sample. The sweetness coefficient for each sugar is calculated according to the horticultural product, for instance, in strawberries, the equation is:
SI = (1.00 [glucose]) + (2.30 [fructose]) + (1.35 [sucrose]) (2)
TA
TA measurements were done by 716 DMS Titrino using Tiamo 2.5 software. Acidity was determined according to the AOAC Official Method 942.15 for Titratable Acidity. Strawberry fruits were homogenized in a blender, and 50 mL of clear juice was collected. All samples were equilibrated to room temperature before pH, and acidity measurements were conducted. Approximately 6 g of juice sample was weighed in a 100 mL beaker, and 50 mL of ultrapure water was added. The mixture was then titrated with 0.1 M NaOH to an end point of 8.2 (measured with a pH meter). TA was calculated using the following formula:
Miliequivalent factor was calculated compared to citric acid.
Organic acids profile
Approximately 0.5 g of dried and ground strawberry sample was extracted with 10 mL ultrapure water for an hour (2 × 30 minutes). For organic acid determination, the extract was diluted 5 times fold, whereas injection volume was 10 µL (Natić et al., 2024).
The organic acid analysis was performed on Dionex ICS 3000 associated with a single-channel pump, conductivity detector and suppressor (DRS 600, Dionex, Dynamically Regenerated Suppressor), eluent generator (EGC III KOH RFIC), autosampler (AS-DV), and Chromeleon software. All separations were made on the analytical column IonPac AS15 (4 × 250 mm) and IonPac AG15 guard column (4 × 50 mm), thermostated to 30ºC. The mobile phase flow rate was 1.0 mL/min, and mobile phase composition was changed (gradient elution) during the analysis in the following order: 0–4 minutes = 10 mM KOH; 4–25 minutes = from 10 mM to 60 mM KOH (ramp); 25–35 minutes = from 60 mM to 10 mM (ramp); and 35–45 minutes = 10 mM. Total analysis run time was 45 minutes.
Sensory analysis
Sensory attributes are determinants of fruit quality and strawberry acceptance by consumers (Resende et al., 2008). Therefore, sensory analysis was conducted by trained panelists to examine the following properties: (1) fruit appearance/attractiveness, (2) color and shine, (3) taste, (4) aroma, (5) S/A ratio, and (6) fruit firmness. These attributes are generally considered as the most important in previous research (Moskowitz et al., 2012; Nollet and Toldra, 2008). It is also in accordance to the protocol which is performed within BerryLAB breeding and selection program. Sensory analysis was performed by five panelists, per each of the harvests during the main picking period, whereas fruits were harvested in an optimal ripeness stage. The overall tests were conducted by using 5-point hedonic scales, and samples were evaluated with scores from 1 (least preferred) to 5 (most preferred). Sensory data are presented as mean values ± standard deviation, calculated from the scores of five trained panelists. The variability of the scores was used as an indicator of panel consistency. Given the limited number of expert panelists (n = 5), sensory results were interpreted descriptively, and statistical analyses were primarily applied to explore relationships between sensory attributes and chemical parameters rather than to draw generalized consumer-related conclusions.
Ethics statement
This sensory evaluation study was conducted at the Faculty of Agriculture, the University of Belgrade –in accordance with the institutional guidelines for research involving human participants (Code of Professional Ethics of the University of Belgrade), the national regulations of the Republic of Serbia, and the ethical principles of the Declaration of Helsinki (2013 revision). According to these guidelines, sensory evaluation studies involving healthy adult participants, where only safe food products are consumed, do not require formal approval from an ethics committee. All participants (n = 5) were fully informed about the study’s purpose and procedures, provided voluntary written informed consent prior to participation, and were informed of their right to withdraw at any time. No personally identifying information was collected, and all data were anonymized.
Statistical analysis of data
Correlation statistical analysis and heatmaps
A heatmap is a data visualization that uses a color coding scheme to indicate various values, and it can be used in various forms of analytics (Zitouni et al., 2020). In this work, heatmaps were used to facilitate the monitoring of the obtained results and in order to determine the possible correlation and linkage between the content of the determined parameters in the case of progeny line and parental line samples. Correlation statistical analysis and heatmaps were performed based on panelists’ ratings and acceptability of strawberry samples and based on the link between the content of panose, sorbitol, mannitol, Brix, the ratio Brix/TA, SI, and TA, and sensory analysis parameters (taste, aroma, and S/A ratio) in the software package R 4.3.1 software (R Foundation for Statistical Computing, Vienna, Austria; https://www.R-project.org).
Principal component analysis (PCA)
In order to gain a more detailed insight into the structure of the data and to identify the similarities and specificity of the grouping of objects, PCA was performed based on the content of sugars, acids, TPC, RSA, SI, Brix, and Brix/TA. This analysis was performed in the software package PLS ToolBox, v.6.2.1 MATLAB 7.12.0 (R2011a). All data were autoscaled before multivariate analysis.
Results and Discussion
Determination of TPC
TPC was measured across all strawberry samples, ranging from 18.2 mg to 26.9 mg GAE/g fresh weight (fw). For the progeny line, TPC values ranged from 16.8 mg to 22.2 mg GAE/g fw, which is consistent with previous literature data for certain strawberry varieties (Aaby et al., 2012; Ristivojević et al., 2022). TPC was found to be higher in the parental line compared to the progeny one (Figure 1, Table 2). The average TPC was 21.4 ± 2.9 mg GAE/g fw for the parental line and 19.7 ± 1.8 mg GAE/g fw for the progeny line (Table 2). Statistical analysis using the Mann–Whitney U Test revealed a significant difference in TPC between the two lines (Z = 2.12; p = 0.033), with a p-value less than 0.05.
Figure 1 Mean values of the content of sugars (g/100 g), organic acids (mg/kg), TPC (mg GAE/g fw), RSA (mmol TE/100 g fw), SI, Brix (°), and Brix/TA with four experimental blocks (plots) for each sample of parental line and progeny line.
Table 2 Mean values of the content of organic acids (mg/kg), sugars (g/100g), TPC (mg GAE/g fw), RSA (mmol TE/100g fw), SI, Brix (°), TA (%), and Brix/TA with four experimental blocks (plots) for each sample and parameters of descriptive statistics for samples’ parental line (1–12) and progeny line (13–24).
| Genotype No. | Genotype | Quinic acid | Shikimic acid | Fumaric acid | Malic acid | Maleic acid | Citric acid | Glu | Fru | Sor | Mann | Ara | Suc | Mel | Isomalt | Raff | Malt | Pan | TPC | RSA | SI | Brix | TA | Brix/TA |
|---|---|---|---|---|---|---|---|---|---|---|---|---|---|---|---|---|---|---|---|---|---|---|---|---|
| 1 | Favette | 9.09 | 13.04 | 18.09 | 7.77 | 2.32 | 4.29 | 8.51 | 10.95 | 0.02 | 0.07 | 0.48 | 0.19 | 0.25 | 0.30 | 0.50 | 0.39 | 0.89 | 20.06 | 37.87 | 33.96 | 9.03 | 0.58 | 17.45 |
| 2 | Alba | 8.43 | 6.28 | 12.62 | 19.55 | 1.81 | 2.88 | 6.59 | 9.24 | 0.01 | 0.21 | 0.24 | 0.06 | 1.00 | 0.49 | 0.53 | 0.43 | 0.94 | 19.68 | 34.60 | 27.91 | 8.17 | 0.63 | 17.57 |
| 3 | Asia | 6.18 | 4.59 | 8.43 | 8.44 | 2.19 | 2.08 | 6.66 | 8.77 | 0.03 | 0.19 | 0.10 | 0.02 | 0.39 | 0.31 | 0.49 | 0.24 | 0.69 | 23.74 | 29.70 | 26.86 | 8.01 | 0.33 | 24.34 |
| 4 | Roxana | 8.36 | 13.53 | 12.22 | 12.93 | 2.72 | 2.81 | 8.13 | 10.20 | 0.02 | 0.24 | 0.23 | 0.04 | 0.16 | 0.34 | 0.33 | 0.30 | 0.77 | 23.68 | 34.99 | 31.64 | 6.86 | 0.43 | 17.86 |
| 5 | Monterey | 8.18 | 9.59 | 10.09 | 13.84 | 1.62 | 3.44 | 6.04 | 8.65 | 0.02 | 0.30 | 0.25 | 0.08 | 0.12 | 0.24 | 0.23 | 0.21 | 0.63 | 26.94 | 32.38 | 26.03 | 8.90 | 0.47 | 21.79 |
| 6 | Portola | 7.74 | 8.54 | 8.72 | 9.25 | 2.54 | 2.95 | 6.84 | 10.17 | 0.01 | 0.11 | 0.13 | 0.07 | 0.13 | 0.25 | 0.40 | 0.20 | 0.45 | 18.97 | 31.32 | 30.32 | 7.11 | 0.55 | 13.97 |
| 7 | Clery | 7.65 | 9.24 | 7.96 | 10.88 | 2.76 | 3.48 | 5.91 | 7.93 | 0.02 | 0.07 | 0.22 | 0.06 | 0.10 | 0.26 | 0.37 | 0.25 | 0.69 | 18.33 | 37.95 | 24.23 | 10.11 | 0.48 | 24.00 |
| 8 | Pir 5 | 6.96 | 8.55 | 8.08 | 6.58 | 1.37 | 2.62 | 7.41 | 10.63 | 0.02 | 0.07 | 0.22 | 0.04 | 0.32 | 0.27 | 0.47 | 0.24 | 0.61 | 19.91 | 29.02 | 31.92 | 9.91 | 0.65 | 16.75 |
| 9 | Dely | 9.99 | 11.14 | 9.22 | 12.88 | 3.53 | 3.57 | 7.73 | 12.58 | 0.02 | 0.05 | 0.33 | 0.09 | 0.69 | 0.34 | 0.71 | 0.41 | 0.96 | 20.41 | 36.59 | 36.78 | 9.64 | 0.42 | 24.36 |
| 10 | Eva | 11.88 | 14.84 | 9.68 | 15.58 | 1.89 | 3.77 | 10.48 | 15.45 | 0.01 | 0.04 | 0.14 | 0.01 | 0.53 | 0.27 | 0.57 | 0.20 | 0.67 | 18.18 | 28.09 | 46.03 | 6.48 | 0.47 | 13.50 |
| 11 | Syria | 6.61 | 7.52 | 9.00 | 9.63 | 3.03 | 3.00 | 6.96 | 11.83 | 0.02 | 0.06 | 0.14 | 0.05 | 0.27 | 0.25 | 0.33 | 0.24 | 0.67 | 25.76 | 26.90 | 34.23 | 7.30 | 0.57 | 12.23 |
| 12 | San Andreas | 8.53 | 12.39 | 7.51 | 6.88 | 1.67 | 3.03 | 6.47 | 10.03 | 0.03 | 0.04 | 0.24 | 0.03 | 0.21 | 0.30 | 0.32 | 0.20 | 0.88 | 21.54 | 32.04 | 29.58 | 7.92 | 0.93 | 10.34 |
| 13 | Ter 122.2 | 10.05 | 13.83 | 8.17 | 14.80 | 1.93 | 4.07 | 4.74 | 8.27 | 0.01 | 0.04 | 0.17 | 0.04 | 0.60 | 0.22 | 0.26 | 0.18 | 1.06 | 21.99 | 27.29 | 23.80 | 9.47 | 0.43 | 23.30 |
| 14 | Ter 91.16 | 8.05 | 12.81 | 7.70 | 12.01 | 2.86 | 3.80 | 6.05 | 10.16 | 0.03 | 0.33 | 0.28 | 0.06 | 0.10 | 0.21 | 0.37 | 0.13 | 0.62 | 21.05 | 31.94 | 29.49 | 7.68 | 0.60 | 13.47 |
| 15 | BL34 Sandra | 7.57 | 9.05 | 7.37 | 6.79 | 2.75 | 2.75 | 3.96 | 7.33 | 0.03 | 0.29 | 0.22 | 0.01 | 0.12 | 0.29 | 0.33 | 0.24 | 0.75 | 19.26 | 28.47 | 20.83 | 9.60 | 0.43 | 23.28 |
| 16 | BL 29 Nadja | 9.30 | 8.59 | 7.59 | 14.09 | 1.75 | 2.61 | 8.61 | 12.73 | 0.04 | 0.07 | 0.22 | 0.03 | 0.30 | 0.26 | 0.46 | 0.32 | 1.05 | 17.57 | 31.81 | 37.92 | 8.23 | 0.43 | 21.91 |
| 17 | AR.Nº5 | 8.43 | 8.64 | 5.65 | 13.51 | 1.67 | 2.82 | 3.79 | 7.92 | 0.05 | 0.18 | 0.22 | 0.07 | 0.21 | 0.36 | 0.46 | 0.27 | 0.74 | 17.92 | 34.65 | 22.08 | 9.25 | 0.47 | 21.39 |
| 18 | AR.Nº10 | 6.89 | 6.60 | 8.90 | 12.82 | 2.61 | 3.01 | 2.47 | 5.59 | 0.06 | 0.38 | 0.20 | 0.02 | 0.18 | 0.32 | 0.42 | 0.34 | 0.73 | 16.80 | 34.37 | 15.37 | 9.53 | 0.40 | 25.55 |
| 19 | AR.Nº26 | 6.18 | 4.52 | 4.04 | 6.44 | 2.12 | 2.07 | 2.03 | 5.00 | 0.05 | 0.25 | 0.11 | 0.01 | 0.11 | 0.27 | 0.28 | 0.15 | 0.76 | 19.11 | 24.86 | 13.55 | 9.66 | 0.43 | 24.02 |
| 20 | A.5.2 | 7.46 | 5.14 | 12.30 | 8.28 | 1.64 | 2.93 | 8.35 | 12.31 | 0.06 | 0.45 | 0.12 | 0.01 | 0.17 | 0.31 | 0.44 | 0.43 | 1.31 | 21.43 | 33.21 | 36.66 | 9.14 | 0.44 | 25.84 |
| 21 | BL 42 Federica | 8.46 | 9.94 | 11.46 | 14.55 | 4.14 | 3.94 | 9.99 | 15.26 | 0.04 | 0.50 | 0.27 | 0.01 | 0.57 | 0.37 | 0.37 | 0.33 | 0.77 | 22.15 | 27.05 | 45.10 | 9.59 | 0.69 | 16.69 |
| 22 | 11.22.8 | 7.35 | 9.39 | 6.52 | 13.97 | 2.83 | 2.84 | 3.51 | 6.56 | 0.01 | 0.03 | 0.13 | 0.00 | 0.11 | 0.20 | 0.70 | 0.11 | 0.56 | 17.99 | 37.48 | 18.60 | 10.01 | 0.61 | 19.05 |
| 23 | RZ.16.9 | 3.25 | 8.81 | 8.49 | 7.70 | 1.50 | 1.95 | 5.56 | 9.26 | 0.03 | 0.07 | 0.11 | 0.00 | 0.06 | 0.21 | 0.34 | 0.15 | 0.75 | 20.29 | 35.19 | 26.85 | 10.14 | 0.59 | 17.94 |
| 24 | 11.95.15 | 8.51 | 11.99 | 9.02 | 14.83 | 1.57 | 3.26 | 3.89 | 6.60 | 0.02 | 0.07 | 0.24 | 0.01 | 0.09 | 0.26 | 0.34 | 0.22 | 0.68 | 20.18 | 32.51 | 19.09 | 10.23 | 0.46 | 23.68 |
| Parental line | Mean | 8.30 | 9.94 | 10.14 | 11.18 | 2.29 | 3.16 | 7.31 | 10.53 | 0.02 | 0.12 | 0.23 | 0.06 | 0.35 | 0.30 | 0.44 | 0.28 | 0.74 | 21.43 | 32.62 | 31.62 | 8.29 | 0.54 | 17.85 |
| Std dev | 1.54 | 3.11 | 2.97 | 3.90 | 0.65 | 0.59 | 1.28 | 2.04 | 0.01 | 0.09 | 0.10 | 0.05 | 0.27 | 0.07 | 0.13 | 0.09 | 0.15 | 2.92 | 3.79 | 5.84 | 1.23 | 0.15 | 4.87 | |
| Min | 6.18 | 4.59 | 7.51 | 6.58 | 1.37 | 2.08 | 5.91 | 7.93 | 0.01 | 0.04 | 0.10 | 0.01 | 0.10 | 0.24 | 0.23 | 0.20 | 0.45 | 18.18 | 26.90 | 24.23 | 6.48 | 0.33 | 10.34 | |
| Max | 11.88 | 14.84 | 18.09 | 19.55 | 3.53 | 4.29 | 10.48 | 15.45 | 0.03 | 0.30 | 0.48 | 0.19 | 1.00 | 0.49 | 0.71 | 0.43 | 0.96 | 26.94 | 37.95 | 46.03 | 10.11 | 0.93 | 24.36 | |
| Progeny line | Mean | 7.62 | 9.11 | 8.10 | 11.65 | 2.28 | 3.00 | 5.25 | 8.91 | 0.04 | 0.22 | 0.19 | 0.02 | 0.22 | 0.27 | 0.40 | 0.24 | 0.82 | 19.65 | 31.57 | 25.78 | 9.38 | 0.50 | 21.35 |
| Std dev | 1.73 | 2.84 | 2.27 | 3.34 | 0.78 | 0.67 | 2.54 | 3.15 | 0.02 | 0.17 | 0.06 | 0.02 | 0.18 | 0.06 | 0.12 | 0.10 | 0.22 | 1.81 | 3.84 | 9.77 | 0.75 | 0.10 | 3.80 | |
| Min | 3.25 | 4.52 | 4.04 | 6.44 | 1.50 | 1.95 | 2.03 | 5.00 | 0.01 | 0.03 | 0.11 | 0.00 | 0.06 | 0.20 | 0.26 | 0.11 | 0.56 | 16.80 | 24.86 | 13.55 | 7.68 | 0.40 | 13.47 | |
| Max | 10.05 | 13.83 | 12.30 | 14.83 | 4.14 | 4.07 | 9.99 | 15.26 | 0.06 | 0.50 | 0.28 | 0.07 | 0.60 | 0.37 | 0.70 | 0.43 | 1.31 | 22.15 | 37.48 | 45.10 | 10.23 | 0.69 | 25.84 |
Notes: Sugars: Glu – Glucose, Fru – Fructose, Sor – Sorbitol, Mann – Mannitol, Ara – Arabinose, Suc – Succrose, Mel – Melibiose, Isomalt – Isomaltose, Raf – Raffinose, Malt – Maltose, Pan – Panose.
These results highlight the variability in phenolic content, which can be influenced by several factors, including genetic background and differences in the harvest timing, since all cultivars were grown in the same plantation but could not be collected on the same day. While the progeny line exhibited slightly lower phenolic content, it is important to note that phenolic composition is a complex trait, and other metabolic factors, such as the presence of co-occurring secondary metabolites, may also contribute to differences in TPC (Aaby et al., 2012).
Determination of RSA
RSA was evaluated in all strawberry samples, with the parental line exhibiting a higher RSA (32.6 ± 3.8 mmol TE/100 g fruit fw) compared to the progeny line (31.6 ± 3.8 mmol TE/100 g fw) (Figure 1, Table 2). However, the Mann–Whitney U Test did not reveal a statistically significant difference in RSA between the two lines, with p-values greater than 0.05. The observed RSA values were consistent with, or higher than, those reported in the literature for certain strawberry varieties such as Favette, Alba, and Clery, which ranged from 16.3 to 24.1 mmol TE/100 g fruit fw (Fotirić Akšić et al., 2019).
Given the higher TPC in the parental line, it is unsurprising that it also exhibited greater RSA. Although phenolic compounds are the main contributors to DPPH RSA, the assay remains nonspecific and can be influenced by the qualitative composition of phenolics, the presence of other reducing agents, and matrix effects. Therefore, RSA and total polyphenol content may not always show perfectly proportional trends.
Brix degrees measurement (ºBx)
Brix is one of the most commonly measured factors for evaluating taste, sweetness, palatability, and consumer acceptability. Increasing the value of this factor indicates increases in the perceived sweetness of fresh strawberry samples which may be the reason for better acceptance by consumers (Ikegaya et al., 2019). In the samples analyzed in this study, Brix content varied from 6.9º to 10.1º units (with an average value of 8.3 ± 1.2 Brix units) in the parental line, while Brix units in progeny genotypes ranged from 7.7º to 10.2º (with an average value of 9.4 ± 0.8 Brix units). If we take into account that Brix units of a minimum of 7 (Acidity Meter & Brix-Acidity Meter Catalogue by Atago) are considered as standard of acceptable taste, having a higher Brix range of new genotypes compared to the parental varieties is a good indicator that new selection material performed better in evaluation, looking very promising regarding this important sweetness parameter.
The good acceptance and rating of progeny strawberry cultivars BL34 Sandra, BL29 Nadja, and BL42 Federica by panelists can also be explained by the high value for the Brix parameter. The values of the Brix parameter for the samples BL34 Sandra were 9.6º and BL42 Federica were 9.6º, while the value of this parameter for the sample BL29 Nadja was lower (Table 2). However, high Brix values indicate increases in the perceived sweetness which explains why these genotypes are highly rated and confirms the fact that these three mentioned genotypes are currently considered highly promising future varieties and are currently highly demanded varieties on the European market. Also, it should be noted that new promising strawberry genotypes 11.22.8, RZ.16.9, and 11.95.15 have very high values for the Brix parameter (exceeding 10.0º) (Table 2). It can be explained by the fact that samples 11.22.8 and RZ.16.9. share a male parent, while samples RZ.16.9 and 11.95.12 share a female parent in the breeding process.
Sugar profile
Soluble carbohydrates are primary metabolites and play an important role in the plant’s response to stress and maintain photosynthetic capacity by maintaining cell membrane stability. In this way, they keep the plant viable independently, protecting the photosynthetic system from damage (Zhao et al., 2022). In all investigated strawberry samples, nine sugars and two sugar alcohols (Table 2) were determined. The most dominant sugars in strawberry samples were fructose and glucose (Figure 1, Table 2), which is in line with previous reports (Milosavljević et al., 2023).
Taking into consideration simple sugars, panose was the most abundant in the studied samples. Sorbitol, mannitol, and panose content were higher in the progeny line, while other sugars had higher content in the parental line (glucose, fructose, arabinose, sucrose, melibiose, raffinose, and maltose) (Figure 1, Table 2). A sum of average values of glucose, fructose, and sucrose was found to be 16.1 g/100 g, which is in line with a previous report (Milosavljević et al., 2023). From all the progeny lines included in the research, BL42 Federica was predominant in glucose content (10.0 g/100 g), whereas variety Eva had the highest glucose content (10.5 g/100 g) within samples from the parental line. Genotype BL42 Federica was also reported as dominant in glucose concentration among 25 different strawberry cultivars, as reported by Milosavljević et al. (2023). The Mann–Whitney U Test revealed a statistically significant difference in the content of mannitol (Z = 2.64; p = 0.008) and sucrose (Z = 3.12; p = 0.002) between the parental and progeny lines, with p-values less than 0.05. It was observed that sugars, free fatty acids, amino acids and their derivatives, organic acids, and flavonoids accumulate in the plant to varying extents as a result of stress during its growth and development. It has been proven that, in case of exposure of the plant to stress, the content of panose among the sugars increases significantly. In contrast, the levels of certain phosphate sugars and organic acids decrease to maintain the osmotic balance, and thus the plant becomes more resistant to stress factors. Based on the obtained results for the sugar content of the parental line and progeny line, it may be inferred that the crossing produced genotypes with a lower content of organic acids and a larger level of panose, making them more stress-resistant (Zhao et al., 2022). In higher plants, alditols and mannitol are osmolytes and solutes that provide resistance against various abiotic stresses; therefore; their higher content in progeny line compared to parental line could be useful in their protection against abiotic stresses.
Therefore, the sugar profile, especially sugar alcohols content/presence, could potentially be used as an indicator for strawberry variety selection toward premium quality variety, based on the ratio of individual sugars.
SI
The SI was calculated according to Equation (3). The parental line exhibited a higher SI than the progeny line, reflecting its higher total sugar content (Figure 1, Table 2). The SI values were 31.6 ± 5.8 for the parental line and 25.8 ± 9.8 for the progeny line (Table 2), which is in agreement with previously reported findings (Milosavljević et al., 2023). The higher SI in the parental line is expected, as these genotypes generally contained higher concentrations of glucose, fructose, and sucrose.
According to the previously mentioned authors (Milosavljević et al., 2023), new genotype BL 34 Sandra had one of the highest SI values (15.0) among the 25 investigated cultivars, which is in accordance with results gained in current research (20.8). However, the highest SI was obtained in parental variety Eva (46.0), followed by new progeny genotypes BL 42 Federica (45.1) and BL 29 Nadja (39.9). There was a similar pattern between genotype ranking in terms of SI value and genotype ranking for fructose and glucose content, which could imply that taste is more influenced by monosaccharides in strawberry fruit (Milosavljević et al., 2023).
Due to above mentioned factors, the SI could be used as a parameter for rough assessment of sweetness and sugar content at the very beginning of the research, for identification and verification of different strawberry cultivars, as well as for other berries.
TA
TA is the second most often measured factor used to assess taste, palatability, and consumer acceptance. The primary organic acids found in strawberry, citric, and malic acids, make up the majority of TA (Koyuncu and Tuba 2010; Paparozzi et al., 2018).
In this study, TA values were similar for both the parental and progeny lines, with an average value of 0.54 ± 0.15 (% TA) for the parental line and 0.50 ± 0.10 (% TA) for the progeny line (Table 2). Although TA is not a direct sum of individual organic acids, the measured TA values aligned with the relative contributions of citric and malic acids in each line (Figure 1, Table 2), which is in accordance with literature data (Milosavljević et al., 2023). Also, TA values of the progeny line were in line with the literature data (Caner et al., 2008; Mancini et al., 2020). The parental line was expected and confirmed to record higher TA compared to new genotypes in evaluation. This could be supported by the fact that breeding and selection process incentives were given toward better fruit quality, less acidity in fruits, and hence a better ratio between sweetness and acidity.
Namely, organic acids have a higher effect on taste because they make food more sour, which makes it harder to taste sweet (Ikegaya et al., 2019). Because of this, the Brix/TA ratio is frequently employed as a gauge of strawberry sweetness. These values of the Brix/TA ratio were an average of 17.9 ± 4.9 for the parental line and 21.4 ± 3.8 for the progeny line (Table 2). Samples with higher Brix and lower TA are preferable, leading to a higher Brix/TA ratio, such as the one in the new promising progeny line, which once again confirms the reason for their better acceptability by panelists.
Organic acids profile
In this work, six organic acids were analyzed in both parental and progeny lines. Malic acid was the most abundant in most progeny samples, whereas the parental line showed higher concentrations of quinic, shikimic, fumaric, and maleic acids. Statistically significant differences between parental and progeny lines were observed for malic (higher in progeny) and citric acid (higher in parental), as shown in Table 2 and Figure 1. It should be noted that each organic acid contributes differently to total acidity, both chemically and in terms of sensory perception, with malic acid providing a refreshing tartness and citric acid contributing sourness to the fruit.
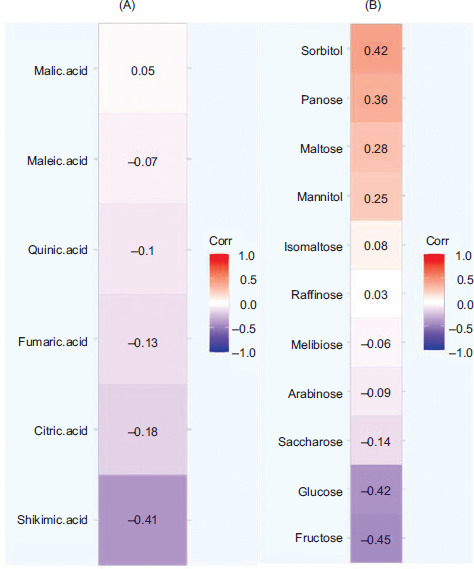
Although glucose and fructose are the predominant sugars in strawberry, the Brix value represents the Brix content and includes contributions from all soluble sugars, organic acids, and other soluble metabolites. Therefore, their individual correlations with the Brix/TA ratio do not necessarily reflect their quantitative dominance. In this study, sugars such as sorbitol, panose, maltose, and mannitol, together with malic acid, showed positive -correlations with the Brix/TA ratio (Figure 2A and Figure 2B), which is consistent with their higher concentrations in the progeny line. These results support the direction of breeding efforts aimed at improving fruit quality through a more favorable sweetness-to-acidity balance.
Figure 2 Correlation between individual organic acids (A) individual sugars (B) and the value of ratio Brix/TA. The influence of individual components and their contribution to the value of the parameter Brix/TA.
Based on the obtained results, it can be concluded that the parental lines for strawberry samples are, in general, more acidic than samples of a progeny line, which goes in accordance with earlier research (Milosavljević et al., 2023).
On the other hand, it should be specifically -monitoring the content of citric and malic acids, because they are considered the most abundant acids in strawberry and directly affect the taste of the fruit (Flores Cantillano and Silva 2010). Citric acid gives sourness to the fruit, and malic acid provides a refreshingly tart taste (Rubico and McDaniel 1992). Based on those results, the parental line had a higher value of citric acids, thus a sour taste was more pronounced, while the progeny line had higher values of malic acid, and therefore had a refreshing taste. It is also consistent with the ratings of panelists, who gave lower ratings for aroma, taste, and S/A ratio in parental lines of strawberry samples compared to samples of a progeny line (Table 3).
Table 3 Results of sensory analysis—average panelists ratings for parental (1–12) and progeny (13–24) lines for determined fruit quality attributes such as: fruit attractiveness/appearance, color and shine, taste, aroma, the ratio between sugar and acidity, and fruit firmness.
| Genotype No. | Genotype | Fruit appearance/attractiveness | Color and shine | Taste | Aroma | Sugar/acid ratio | Fruit firmness | Average |
|---|---|---|---|---|---|---|---|---|
| 1 | Favette | 3.1 | 3.7 | 3.3 | 3.7 | 3.4 | 3.1 | 3.4 |
| 2 | Alba | 4.0 | 4.8 | 3.4 | 2.7 | 2.7 | 4.6 | 3.8 |
| 3 | Asia | 4.7 | 4.1 | 3.3 | 3.4 | 3.2 | 3.9 | 3.6 |
| 4 | Roxana | 3.4 | 3.9 | 2.9 | 2.9 | 2.9 | 4.1 | 3.3 |
| 5 | Monterey | 4.2 | 4.1 | 3.3 | 3.1 | 3.1 | 4.9 | 3.8 |
| 6 | Portola | 4.9 | 4.6 | 3.3 | 3.4 | 3.4 | 5.0 | 4.1 |
| 7 | Clery | 4.9 | 4.8 | 4.0 | 4.0 | 3.9 | 4.9 | 4.4 |
| 8 | Pir 5 | 4.7 | 4.4 | 4.6 | 4.3 | 4.5 | 4.9 | 4.6 |
| 9 | Dely | 4.5 | 4.5 | 4.1 | 4.5 | 3.9 | 3.9 | 4.2 |
| 10 | Eva | 3.2 | 3.0 | 3.8 | 4.3 | 4.0 | 3.6 | 3.6 |
| 11 | Syria | 3.5 | 3.9 | 3.4 | 4.2 | 3.2 | 4.4 | 3.8 |
| 12 | San Andreas | 4.1 | 4.4 | 2.8 | 2.6 | 2.8 | 4.9 | 3.6 |
| Average | 4.1 ± 0.6 | 4.2 ± 0.5 | 3.5 ± 0.5 | 3.6 ± 0.6 | 3.4 ± 0.5 | 4.3 ± 0.6 | 3.8 ± 0.4 | |
| 13 | Ter 122.2 | 3.6 | 3.5 | 3.3 | 3.4 | 3.4 | 3.8 | 3.5 |
| 14 | Ter 91.16 | 4.0 | 4.1 | 3.1 | 3.1 | 3.1 | 3.8 | 3.5 |
| 15 | BL34 Sandra | 4.9 | 5.0 | 4.7 | 4.7 | 4.8 | 4.9 | 4.8 |
| 16 | BL 29 Nadja | 4.9 | 4.9 | 4.1 | 4.3 | 4.2 | 5.0 | 4.6 |
| 17 | AR.Nº5 | 4.8 | 4.8 | 4.8 | 4.8 | 4.3 | 4.3 | 4.6 |
| 18 | AR.Nº10 | 4.3 | 4.2 | 3.7 | 4.1 | 3.9 | 4.2 | 4.0 |
| 19 | AR.Nº26 | 4.7 | 4.7 | 4.6 | 4.6 | 4.3 | 4.5 | 4.6 |
| 20 | A.5.2 | 4.5 | 4.5 | 4.3 | 4.4 | 4.2 | 4.9 | 4.5 |
| 21 | BL 42 Federica | 5.0 | 4.9 | 5.0 | 5.0 | 5.0 | 5.0 | 5.0 |
| 22 | 11.22.8 | 3.8 | 4.0 | 3.8 | 3.9 | 3.7 | 4.3 | 3.9 |
| 23 | RZ.16.9 | 4.5 | 4.7 | 3.8 | 3.5 | 3.4 | 4.4 | 4.0 |
| 24 | 11.95.15 | 4.3 | 4.3 | 3.9 | 4.2 | 3.8 | 4.4 | 4.1 |
| Average | 4.4 ± 0.5 | 4.5 ± 0.5 | 4.1 ± 0.6 | 4.2 ± 0.6 | 4.0 ± 0.6 | 4.5 ± 0.4 | 4.3 ± 0.5 |
Sensory analysis was used to confirm the obtained results for the sugar and organic acid profile in studied strawberry samples. The content of individual acids and sugars was in accordance with the ratings of the panelists who participated in the sensory analysis (Tables 2 and 3). Therefore, we can conclude that the profile of sugars and organic acids significantly influences panelists’ acceptability in terms of sensory properties.
Sensory analysis
Results of the sensory analysis indicate that the progeny lines had a total average mark (4.3 ± 0.5) value higher than the parental line (3.8 ± 0.4) (Table 3), which leads to an assumption that new strawberry genetic material might be more satisfactory to the market consumers. The new progeny genotypes performed better in each of the evaluated parameters that affect fruit quality, such as attractiveness/appearance, color and shine, taste, aroma, and S/A ratio (Table 3). Besides that, new genotypes had better fruit firmness, which is an attribute mainly controlled by genotype (Fan et al., 2021). Firmness strongly influences the fruit shelf-life and its transportability to distant markets—a key factor for overall fruit marketability. While taste is strongly cultivar-dependent, it is also influenced by the degree of fruit maturity and environmental/cultivation conditions (e.g., temperature during ripening), which modulate the concentrations of sugars, acids, and volatile compounds in fruits (Fan et al., 2021; Hwang et al., 2019; Resende et al., 2008; Schwieterman et al., 2014). The aroma however derives from different VOCs, such as esters, alcohols, ketones, furans, terpenes, aldehydes, and sulfurous compounds, which add up to a complex and distinctive strawberry profile (Padilla-Jiménez et al., 2021). Overall, fruity and floral strawberry aroma derives particularly from methyl and ethyl esters (Abouelenein et al., 2023).
It should be noted that the sensory evaluation was conducted with a small panel of five trained assessors. This approach is appropriate for profiling and comparing sensory attributes in a controlled and reproducible manner but does not fully represent general consumer preferences. Consequently, while the results provide an insight into relative differences in sensory quality among genotypes, they cannot be interpreted as direct measures of overall acceptability. To confirm consumer preference and market acceptability, further studies with a larger and more diverse group of untrained consumers would be necessary (Resende et al., 2008). We performed one-way ANOVA for each sensory attribute to evaluate the panel’s ability to discriminate among strawberry samples. Significant differences among samples were observed for taste, aroma, and the sugar/acid ratio (p < 0.05), indicating that the panel could reliably distinguish these attributes. For fruit appearance/attractiveness, color and shine, and firmness, no significant differences were detected (p > 0.05).
Also, results of the sensory analysis show that progeny strawberry cultivars BL34 Sandra, BL29 Nadja, BL42 Federica, AR.Nº5, and AR.Nº26 were found to be the most prominent and the best rated by panelists for all of the evaluated attributes (Table 3). These results were in line with the fact that genotypes BL34 Sandra and BL42 Federica have been registered in the meantime on the European (https://cpvo.europa.eu/en) and Serbian (https://sorte.minpolj.gov.rs/) list of varieties, after performing well on the DUS test, whereas genotype BL29 Nadja has just been registered in the beginning of 2026. Genotype BL29 Nadja is still in the process of registration, while for AR.Nº5 and AR.Nº26, good evaluations might be a consequence of the same parental varieties used in those crossings. Moreover, all of the mentioned best-preferred genotypes, except BL42 Federica, have had one of the parents used in the hybridization process in common. These results also lead to an assumption that the results of sensory analysis evaluations comply with the Brix/TA ratio for all samples.
PCA and heatmaps
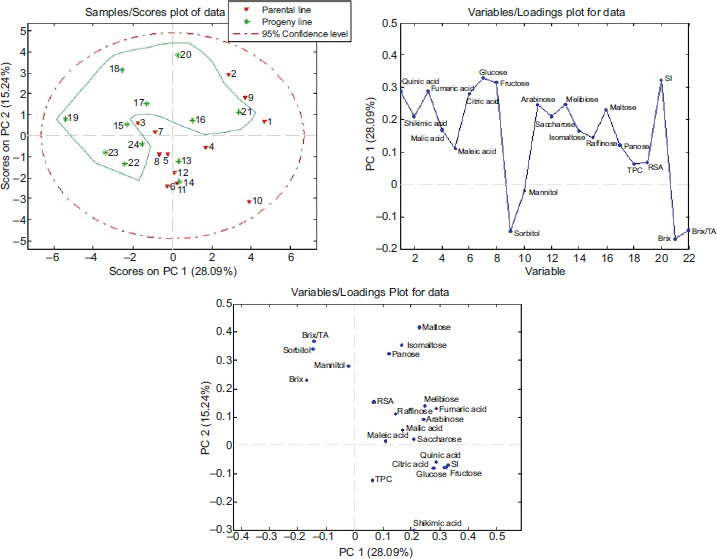
In order to get a more detailed insight into the data structure and identify similarities and specificities of object groupings, PCA was conducted based on mean values of sugars, acids, TPC, RSA, SI, Brix, and Brix/TA (Table 2) in the samples of strawberry—parental line and progeny line. PCA results in a seven-component model that explains 83.17% of total variance within the data. The results obtained through analyzing the first two principal components based on the contents of the mentioned parameters (Table 2) in parental line and progeny line samples of strawberries are shown on scores plot (Figure 3A) and loading plots (Figure 3B and 3C).
Figure 3 PCA based on mean values of sugars, acids, TPC, RSA, SI, Brix, and Brix/TA (B and C) in the samples of -strawberries—parental line (1–12) and progeny line (13–24) (A).
The first principal component explains 28.09% of the total variance within the data, while the second explains 15.24%. When examining natural samples with a wide range of parameters (variables) and relatively high sample variability, with the fact that the progeny lines were obtained by crossing the parental lines, it is typical to find a low overall data variance captured by a few PCs.
Based on the obtained results on the scores plot (Figure 3A), a completely clear separation of the progeny line from the parental line cannot be observed, but it can be noted that the progeny samples were grouped predominantly in the negative part along the PC1 axis, that is, the positive part along PC2 axes. It can be concluded that the main factors influencing the separation of the progeny line from the parental line along the PC1 axis are sorbitol, mannitol, Brix, and the Brix/TA ratio (Figure 3B and 3C), which is in accordance with the obtained and previously explained results.
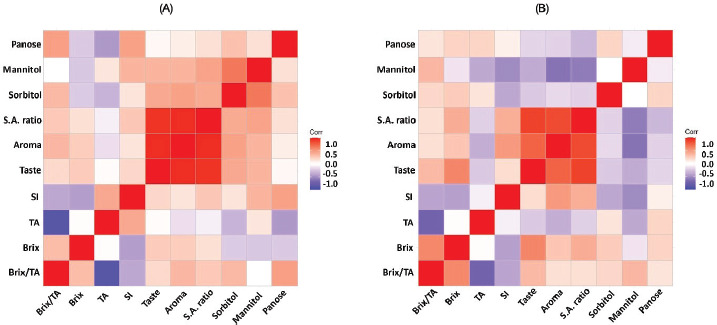
The result of the PCA analysis was used for further selection of the parameters that distinguish the progeny line from the parental one. Sorbitol, mannitol, Brix, and the ratio Brix/TA were selected as the main factors. In addition, the panose content was also taken into consideration because it is higher in the progeny line samples than the parental line sample, and the SI and total acidity (TA) which have the opposite tendency (Table 2). Based on selected parameters, correlation statistical analysis was performed in order to determine the possible linkage between the content of panose, sorbitol, mannitol, Brix, the ratio Brix/TA, SI, and TA in the progeny line and parental line samples (Table 2) as well as sensory analysis parameters (taste, aroma, sugar and acids ratio (S.A.), which could explain the better acceptability of the progeny line by panelists compared to the parental line, which was proven by the results of the sensory analysis (Table 3). The results of correlation statistical analysis are given in Figure 4.
Figure 4 Heatmaps—correlation of the content of panose, sorbitol, mannitol, Brix, the ratio of Brix/TA, SI, and TA, and -sensory analysis parameters (taste, aroma, sugar/acidity ratio [S.A.]) in progeny line samples (A) and parental line samples (B).
Based on the results, it can be concluded that the content of sugar alcohols positively correlates with sensory analysis parameters in the case of progeny line samples, while the correlation is negative in parental line samples (Figure 4). This confirms that these parameters can be responsible for the better acceptability of the progeny line by panelists (Table 3). A similar trend was recorded for the content of the panose. On the other hand, TA in both cases shows a negative correlation with sensory analysis parameters, but in the case of the parental line, the correlation is more negative compared to the progeny line samples (Figure 4), which is consistent with the fact that the content of TA (Table 2) as well as the content of individual acids (Figure 1, Table 2) is higher in parent line samples than in progeny line.
The SI parameter was higher in the parental line, which is consistent with its higher total sugar content (Figure 1, Table 2). However, this did not translate into a superior sensory perception of taste and aroma. This can be explained by the fact that panelists’ perceived aroma is not determined exclusively by VOCs but also by nonvolatile constituents such as sugars and organic acids, which modulate aroma perception through cross-modal interactions. Higher sugar levels typically enhance fruity aromatic notes, while organic acids contribute to freshness and overall flavor balance; therefore, the optimal sugar/acid ratio is crucial for achieving a pleasant aroma–taste interaction (Klee and Tieman, 2018, Schwieterman et al., 2014). In our study, progeny lines showed a more favorable sugar/acid balance, resulting in a stronger correlation between SI and aroma rating compared to the parental line. This suggests that despite the higher absolute sugar content in the parent line, the progeny lines possess a more harmonized chemical profile that better supports panelists’ perception of aroma complexity. If the S.A. ratio is taken into consideration, a better correlation with taste and aroma was recorded in progeny line samples (r = 0.94; r = 0.96, respectively; Figure 4), which can be related to the fact that the progeny line has a lower SI due to lower sugar content and lower acid content (Table 2), and panelists find those taste and aroma more preferable and therefore give a higher rating during the sensory analysis (Table 3). Previous reports (Resende et al., 2008) confirm significant positive correlations between taste and aroma (r = 0.81) but also show correlation between aroma and SSC (r = 0.78), taste and SSC (0.98), and negative correlations between aroma and TA (r = −0.6), and taste and TA (r = −0.77).
Overall, the combined analysis of chemical and sensory parameters demonstrates clear distinctions between progeny and parental lines. While total sugar content and the SI were higher in parental samples, this did not directly translate into higher panelists’ acceptability. In contrast, progeny lines exhibited a more balanced composition of sugar alcohols (sorbitol, mannitol, and panose), total sugars, and acids, which was positively correlated with sensory attributes such as taste, aroma, and sugar/acid ratio (Figure 4). TA and individual organic acids were higher in parental lines, which may have negatively influenced perceived taste and aroma. Principal component and correlation analyses further identified Brix, Brix/TA ratio, sugar alcohols, and panose content as key factors distinguishing progeny from parental lines and explaining the higher sensory ratings observed for progeny genotypes (Tables 2 and 3, Figures 3 and 5). These findings highlight that panelists’ perception of strawberry quality is not determined solely by total sugar content, but by a complex interplay between sugars, acids, sugar alcohols, and their relative balance, which collectively shape taste, aroma, and overall acceptability. The results support the effectiveness of the breeding program in producing progeny with improved sensory profiles and fruit quality attributes compared to the parental lines.
Conclusion
Chemical and sensory analyses were performed to assess the acceptability of new strawberry genotypes derived from different selection and breeding materials. A total of 24 strawberry genotypes, including 12 parental varieties and 12 progeny varieties resulting from their hybridization, were analyzed. Key quality parameters such as TPC, RSA, Brix concentration, sugar and organic acid profiles, TA, and SI were measured. In addition, a sensory evaluation by trained panelists was conducted to determine consumer perceptions of quality changes in the strawberry samples resulting from breeding.
The analysis revealed that the parental lines had higher TPC, RSA, and organic acid concentrations, which contributed to a more pronounced sour taste and higher TA. The progeny lines exhibited higher levels of sorbitol, mannitol, and panose, which may enhance stress resistance and lead to a better sweetness-to-acidity balance. Furthermore, the progeny lines had a lower acidity profile, which, coupled with higher Brix values, resulted in a more favorable sensory profile by panelists.
The sensory analysis indicated that the progeny lines were generally better accepted by panelists, with several genotypes, including BL34 Sandra, BL29 Nadja, and BL42 Federica, receiving the highest ratings for overall quality. These progeny genotypes showed significant potential for commercial use, especially in the European market, where higher Brix values are highly appreciated.
In conclusion, the breeding process has successfully yielded new strawberry genotypes with improved quality traits, such as better sweetness, lower acidity, and enhanced consumer appeal. These findings suggest that the progeny lines, particularly BL34 Sandra, BL29 Nadja, and BL42 Federica, are promising candidates for future strawberry cultivation, offering improved fruit quality and higher market demand. To get a more detailed insight into the data structure and identify similarities and specificities of object groupings, PCA was conducted based on mean values of sugars, acids, TPC, RSA, SI, Brix, and Brix/TA. The result of the PCA analysis was used for further selection of the parameters that distinguish the progeny line from the parental line. Sorbitol, mannitol, Brix, and the ratio Brix/TA were selected as the main factors. In addition, the panose content was also taken into consideration because it is higher in the progeny line samples than the parental line, and the SI and TA which have the opposite tendency.
Mandatory Disclosure on Use of Artificial Intelligence
The authors declare that no generative AI or AI-assisted technologies were used in the writing or editing of this manuscript. All content was prepared and reviewed by the authors themselves.
Authors’ Contributions
Nevena N. Momirović did conceptualization, methodology, data curation, and writing—original draft; Mihajlo V. Jakanovski was concerned with conceptualization, data curation, formal analysis, methodology, investigation, and roles/writing—original draft; Aleksandra M. Dramićanin did conceptualization, methodology, investigation, formal analysis, data curation, writing—original draft, review & editing; Mirjana D. Mosić was responsible for formal analysis and methodology; Dragan T. Nikolić was concerned with conceptualization, investigation, and methodology; Nebojša M. Momirović looked into funding acquisition, project administration, and writing—review & editing; Dušanka M. Milojković-Opsenica did conceptualization, methodology, formal analysis, funding acquisition, project administration, and writing—review & editing.
Conflicts of Interest
The authors declare that they have no known competing financial interests or personal relationships that could have appeared to influence the work reported in this paper.
Funding
This research has been financially supported by the Ministry of Science, Technological Development and Innovation of the Republic of Serbia (Contract Numbers: 451-03-136/2025-03/200168, 451-03-136/2025-03/200288, and 451-03-65/2025-03/200116).
REFERENCES
Aaby, K., Sebastian, M., Arnfinn, N., Grete, S. 2012. Phenolic compounds in strawberry (Fragaria × Ananassa Duch.) fruits: composition in 27 cultivars and changes during ripening. Food Chem. 132(1): 86–97. 10.1016/j.foodchem.2011.10.037
Abouelenein, D.; Acquaticci, L.; Alessandroni, L.; Borsetta, G.; Caprioli, G.; Mannozzi, C.; Marconi, R.; Piatti, D.; Santanatoglia, A.; Sagratini, G.; et al. Volatile Profile of Strawberry Fruits and Influence of Different Drying Methods on Their Aroma and Flavor: A Review. Molecules 2023, 28, 5810. 10.3390/molecules28155810
Caner, C., Mehmet, A., Muharrem, D. 2008. Extending the quality of fresh strawberries by equilibrium modified atmosphere packaging. Eur. Food Res. Technol. 227(January): 1575–83. 10.1007/s00217-008-0881-3
Fan, Z., Anne, P., Jinhe, B., Vance, M.W. 2021. Volatiles influencing sensory attributes and bayesian modeling of the soluble solids–sweetness relationship in strawberry. Front. Plant Sci. 12. https://www.frontiersin.org/articles/10.3389/fpls.2021.640704
Flores Cantillano, R.F., & Silva, M.M. da. (2010). Manuseio pós-colheita de morangos. Embrapa Clima Temperado. http://www.infoteca.cnptia.embrapa.br/infoteca/handle/doc/886098
Fotirić Akšić, M., Dabić Zagorac, D., Sredojević, M., Milivojević, J., Gašić, U., Meland, M., & Natić, M. (2019). Chemometric Characterization of Strawberries and Blueberries according to Their Phenolic Profile: Combined Effect of Cultivar and Cultivation System. Molecules, 24(23), 4310. 10.3390/molecules24234310
Fotirić Akšić, M., Dabić Zagorac, D., Gašić, U., Tosti, T., Natić, M., Meland, M., 2022. Analysis of Apple Fruit (Malus × domestica Borkh.) Quality Attributes Obtained from Organic and Integrated Production Systems. Sustainability 14(9), 5300. 10.3390/su14095300
Moskowitz, H.R., Beckley, J.H., & Resurreccion, A.V.A. (2012). Sensory and consumer research in food product design and development (2nd ed.). Wiley-Blackwell.
Horvacki, N.M., Jakanovski, M.V., Krstić, Ð.D., Nedić, J.M., Dramićanin, A.M., Fotirić-Akšić, M.M., & Milojković-Opsenica, D.M. 2025. Evaluation of Sugar and Organic Acid Composition of Apple Cultivars (Malus domestica Borkh.) Grown in Serbia. Processes, 13(10), 3093. 10.3390/pr13103093
Nollet, L.M. L., & Toldrá, F. (eds.). (2008). Handbook of muscle foods analysis. CRC Press.
Hwang, H., Kim, Y.-J., Shin, Y., 2019. Influence of ripening stage and cultivar on physicochemical properties, sugar and organic acid profiles, and antioxidant compositions of strawberries. Food Science and Biotechnology 28(6), 1659–1667. 10.1007/s10068-019-00610-y
Ikegaya, A., Tomoyasu, T., Seiji, O., et al. 2019. Effects of distribution of sugars and organic acids on the taste of strawberries. FSN. 7(7): 2419–26. 10.1002/fsn3.1109
Jayasena, V., and Cameron, I. 2008. Brix/acid ratio as a predictor of consumer acceptability of crimson seedless table grapes. J. Food Qual. 31(November): 736–50. 10.1111/j.1745-4557.2008.00231.x
Kafkas, E., Koşar, M., Paydaş, S., Kafkas, S., Başer, K.H.C. 2007. Quality characteristics of strawberry genotypes at different maturation stages. Food Chem. 100(3): 1229–36. 10.1016/j.foodchem.2005.12.005
Koyuncu, M., and Dilmaçünal, T. 2010. Determination of vitamin C and organic acid changes in strawberry by HPLC during cold storage. Not. Bot. Horti. Agrobo. 38 (July). 10.15835/nbha3834819
Klee, H. J., Tieman, D. M., 2018. The genetics of fruit flavour preferences. Nature Reviews Genetics 19(6), 347–356. 10.1038/s41576-018-0002-5
Magwaza, L.S., and Umezuruike, L.O. 2015. Analytical methods for determination of sugars and sweetness of horticultural products—a review. Sci. Hortic. 184(March): 179–92. 10.1016/j.scienta.2015.01.001
Mancini, M., Luca, M., Francesco, G. et al. 2020. Application of the non-destructive NIR technique for the evaluation of strawberry fruits quality parameters. Foods. 9(4): 4. 10.3390/foods9040441
Mazzoni, L., Lucia, D.V., Francesca, B., et al. 2020. Sensorial and nutritional quality of inter and intra—specific strawberry genotypes selected in resilient conditions. Sci. Hortic. 261(February): 108945. 10.1016/j.scienta.2019.108945
Milosavljević, D., Vuk, M., Jasminka, M., et al. 2023. Sugars and organic acids in 25 strawberry cultivars: qualitative and quantitative evaluation. Plants. 12(12): 12. 10.3390/plants12122238
Natić, M., Dabić Zagorac, D., Jakanovski, M., Smailagić, A., Čolić, S., Meland, M., Fotirić Akšić, M., 2024. Fruit Quality Attributes of Organically Grown Norwegian Apples Are Affected by Cultivar and Location. Plants 13(1), 147. 10.3390/plants13010147mdpi.com
Padilla-Jiménez, S.M., María Valentina, A.P., Hortencia Gabriela, M.V., Guadalupe, O.S., José Luis, M.S., Ernesto, O.Z. 2021. Identification of organic volatile markers associated with aroma during maturation of strawberry fruits. Molecules. 26(2): 504. 10.3390/molecules26020504
Paparozzi, E., George, M., Vicki, S., et al. 2018. Strawberry cultivars vary in productivity, sugars and phytonutrient content when grown in a greenhouse during the winter. Agronomy and Horticulture: Faculty Publications. January 1. https://digitalcommons.unl.edu/agronomyfacpub/1142
Resende, J.T.V., Camargo, L.K.P., Argadona, E.J.S., Marchese, A. 2008. Sensory analysis and chemical characterization of strawberry fruits. Hortic. Bras. 26: 371–74.
Ristivojević, P., Nevena, L., Ilija, C., et al. 2022. Effect-directed profiling of strawberry varieties and breeding materials via planar chromatography and chemometrics. Molecules. 27(18): 6062. 10.3390/molecules27186062
Rubico, S.M., and McDaniel, M.R., 1992. Sensory evaluation of acids by free-choice profiling. Chem. Senses. 17(3): 273–89. 10.1093/chemse/17.3.273
Sone, K., Tatsuya, M., Yuji, N. 2000. Relationship between-stability of eating quality of strawberry cultivars and their sugar and organic acid contents. Engei Gakkai Zasshi. 69(November): 736–43. 10.2503/jjshs.69.736
Schwieterman, M.L., Colquhoun, T.A., Jaworski, E.A., Bartoshuk, L.M., Gilbert, J.L., Tieman, D.M., Odabasi, A.Z., Moskowitz, H.R., Folta, K.M., Klee, H.J., Clark, D.G., 2014. Strawberry Flavor: Diverse Chemical Compositions, a Seasonal Influence, and Effects on Sensory Perception. PLOS ONE 9(2): e88446. 10.1371/journal.pone.0088446
Zhao, X., Li-Juan, H., Xiao, F.S., Li-Li, Z., Pu-Chang, W. 2022. Differential physiological, transcriptomic, and metabolomic responses of paspalum wettsteinii under high--temperature stress. Front. Plant Sci. 13. https://www.frontiersin.org/articles/10.3389/fpls.2022.865608
Zhou, Z.P., Li-Yuan, Z., Jing-Yao, S., Qing-Yun, L., Bing-Bing, C., Xin-Xin, W. 2026. Cultivar-driven variations in physicochemical properties and volatile organic compound profiles of strawberry (Fragaria × Ananassa Duch.). Food Chem. Mol. Sci. 12 (June): 100346. 10.1016/j.fochms.2025.100346
Zitouni, H., Lahcen, H., Rachida, O., et al. 2020. Exploring-antioxidant activity, organic acid, and phenolic composition in strawberry tree fruits (Arbutus Unedo L.) growing in Morocco. Plants. 9(12): 12. 10.3390/plants9121677