
Download
% acidity (in terms of lauric acid) = v × N × 20 m 1 Δ E * = Δ L * 2 + Δ a * 2 + Δ b * 2 2


ORIGINAL ARTICLE
Infrared drying of coconut (Cocos nucifera L.) fruit: Evaluating the effects of process conditions and process optimization
Ceren Bektaş, Onur Ketenoglu*
Eskisehir Osmangazi University, Faculty of Agriculture, Department of Food Enginering Eskisehir, Türkiye
Abstract
Coconut was dried using infrared drying under different drying process conditions in a central composite design (CCD) of response surface methodology (RSM). Moisture content (%), water activity (aw), pH, free acidity (%), total phenolic content (TPC) (mg GAE/g), color, and FTIR spectrum of the dried samples were analyzed, and the total oil content and fatty acid composition of fresh coconut were determined. Mathematical models were built and an optimization was performed for determining the optimum drying condition. The lowest moisture content (1.80%) and water activity (0.283) values were obtained at 250 W lamp power, 240 min drying time, 15 cm lamp distance, and 10 mm sample thickness. The highest TPC was found to be 209.34 mg GAE/g. ΔE* values of dried samples ranged between 0.28 and 19.12. L* values of the dried samples decreased at higher lamp power and longer drying times, while a* and b* values increased. In fresh coconut oil, medium-chain fatty acids were predominant, specifically lauric acid (C12:0) being the dominant fatty acid at 49.78% of the total fatty acids. An overall desirability of 0.766 was obtained from optimization.
Key words: drying, infrared, coconut, physicochemical properties, optimization, mathematical modeling
*Corresponding Author: Onur Ketenoglu, Eskisehir Osmangazi University, Faculty of Agriculture, Department of Food Engineering, 26160, Eskisehir, Turkey. Email: onur.ketenoglu@ogu.edu.tr
Academic Editor: Prof. Lilia Neri, University of Teramo, Italy
Received: 11 November 2025; Accepted: 21 January 2026; Published: 1 April 2026
© 2026 Codon Publications
This is an Open Access article distributed under the terms of the Creative Commons Attribution-NonCommercial-ShareAlike 4.0 International (CC BY-NC-SA 4.0). License (http://creativecommons.org/licenses/by-nc-sa/4.0/)
Introduction
Coconut (Cocos nucifera L.) is a tropical fruit belonging to the Arecaceae family. Coconut is widely grown in more than 90 countries and FAO data of 2023 reveal that the top five important producers of coconut are Indonesia, India, Philippines, Brazil, and Viet Nam (FAO, 2023). Coconut is rich in many nutrients including carbohydrate, protein, lipid, vitamins, and minerals (Divya et al., 2023). According to USDA data, coconut flour is reported to include 34.2 g/100 g of total dietary fiber, 2090 mg/100 g potassium, 15.3 g/100 g total lipid, and 16.1 g/100 g protein (USDA, 2023). As for being a valuable crop, parts of the coconut other than the fruit itself find applications in many areas including food industry, cosmetics, and pharmaceuticals (Divya et al., 2023).
Drying is one of the oldest and well-known food preservation methods applied in many food products. The main purpose of drying is to inhibit any possible microbio-logical growth, which can cause food spoilage. Besides, dried forms of some food products such as mushrooms are more preferable than their fresh forms (Huang et al., 2021). Sun drying and hot air drying methods are the most common drying techniques, but they have some limitations in their applications. Although sun drying is a cost-effective method, it is weather-dependent and has the risk of contamination (Sabbaghi & Nguyen, 2025). Similarly, hot air drying has some disadvantages like high energy consumption and possible nutrient loss (Sabbaghi & Nguyen, 2025). Thus, alternative drying techniques including microwave drying (El-Mesery et al., 2025), spray drying (Glomm et al., 2026), ultrasound assisted drying (Lu et al., 2025), and infrared drying (Dehghannya et al., 2025; Noutfia et al., 2025) have recently been applied in many food products.
Infrared drying has become a promising and advantegous drying technique in recent years. As for being classified depending on the wavelength of the radiation, all infrared types including near-infrared (NIR), middle-infrared (MIR) and far-infrared (FIR) (Wang et al., 2023) can be practically used in drying of foods; however, major components such as proteins, lipids, sugar, and water can mostly absorb FIR (Rosenthal, 1992). Depending on the process conditions and the desired dried product attributions, infrared drying possesses many advantages such as shorter drying time, low energy cost, good product quality, and uniform heat transfer when compared to other traditional drying methods (Alfiya et al., 2025; Huang et al., 2021; Riadh et al., 2015; Sabbaghi & Nguyen, 2025). Additional to these advantages, infrared drying also enables modifiable design, simple equipment construction, and ease of combination with other traditional and novel drying techniques (Huang et al., 2021). According to Sabbaghi & Nguyen (2025), the performance of infrared drying can be affected by the physicochemical attributes of food matrix, moisture content, and thermal properties.
Regarding these greater abilities, infrared drying has increased its popularity among other drying methods and is commonly applied in drying of a wide range of food products including cereals, fruits and vegetables, and meat products (Dehghannya et al., 2025; Ding et al., 2023; Zhu et al., 2024; Junqueira et al., 2024;). Alfiya et al. (2025) compared to conventional sun drying and infrared convective (IRC) drying of turmeric. According to their study, drying time of turmeric slices was 3 h shorter for IRC than sun drying when moisture content of turmeric slices decreased from 76.5% to 7.2% wet basis. Song et al. (2024) studied the effects of infrared drying on jujube by using a response surface methodology (RSM) approach. Their findings revealed that the structure and organizational shape of jujube could be enhanced by using infrared drying compared to hot air drying. Besides, the use of infrared resulted in an increment in the quantities and varieties of the volatile compounds of jujube. Pandiselvam et al. (2024) investigated the effects of various drying techniques including infrared drying, hot air drying, and infrared-assisted hot air drying on the oil quality of coconut. According to their results, the use of infrared-assisted hot air drying at 60°C lead to the highest quality of final product.
This study involves infrared drying of coconuts under varying process conditions, and the changes in physico-chemical attributes of dried samples were determined. To our best knowledge, limited information was available in the drying of coconut using infrared drying as a novel approach; thus, the objective of this study was to systematically evaluate the effects of infrared drying conditions on the physicochemical properties of coconut using the RSM. Furthermore, a multiobjective optimization approach was employed to identify the optimum operating condition that balances the product quality in terms of selected minimized and maximized responses, thereby providing practical guidance for the design of infrared drying processes for coconut.
Material and Methods
Materials
Coconuts to be dried were purchased from local markets in the Eskişehir province of Türkiye. Prior to the experiments, exocarps of the samples were cracked to reveal the endosperm. Then, a size reduction was performed to obtain a more homogenous batch by using a grinder (SCM2934, Sinbo, Türkiye). For analyses, ethanol (Isolab, Germany), methanol (Supelco, Germany), sodium hydroxide solution (Kimyalab, Türkiye), Folin– Ciocalteu reagent (Supelco, Germany), phenolphthalein (Isolab, Germany), sodium carbonate (Merck, Germany), n-hexane (Isolab, Germany), potassium hydroxide (Isolab, Germany), 37 FAME-Mix (Supelco, Germany), and gallic acid (Sigma-Aldrich, Germany) were all chosen at analytical grade.
Experimental setup and design of experiment (DOE) of infrared drying
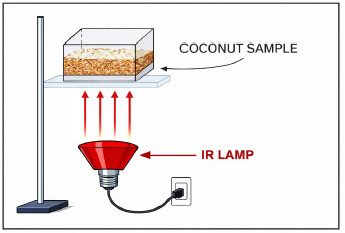
Coconut samples were dried using three different infrared lamps at different power levels: 150, 200, and 250 W. Grounded coconut samples were tightly and uniformly placed in identical glass containers. The schematic drawing of the drying setup is shown in Figure 1. The drying process was visually observed from the beginning to the end to avoid any local undesired burns. After drying was completed under the selected process conditions, the coconut samples were left for cooling in a dessicator. Then, all samples were placed in plastic zipper bags and stored at refrigeration temperature until analyzed.
Figure 1. Schematic drawing of infrared dryer setup.
The DOE was the face-centered type (α=1.0) of central composite design (CCD), which has the ability to capture corner points at extreme process conditions while maintaining experimental feasibility, also enabling a robust statistical evaluation of the data. The selection of α=1.0 ensured that all factor levels remained within the operational limits of the infrared system, in particular lamp power.
The independent variables were lamp power (x1), drying time (x2), distance between lamp surface and sample (x3), and sample thickness (x4). Based on the findings of preliminary studies, the levels of these variables were chosen as the following:
-
x1: 150, 200, and 250 W
-
x2: 30, 135, and 240 min
-
x3: 15, 20, and 25 cm
-
x4: 10, 15, and 20 mm
All experiments were duplicated with a total number of 62 runs having 14 of them in the center point. The DOE in both coded and uncoded variables is presented in Table 1.
Table 1. Design of experiment including both coded and uncoded parameters.
| Experiment # | Uncoded parameters | Coded parameters | ||||||
|---|---|---|---|---|---|---|---|---|
| Lamp power (W) | Time (min) | Lamp distance (cm) thickness (mm) |
Sample | Lamp power (W) | Time (min) | Lamp distance (cm) thickness (mm) |
Sample | |
| (x1) | (x2) | (x3) | (x4) | (x1) | (x2) | (x3) | (x4) | |
| 1 | 150 | 30 | 15 | 10 | −1 | −1 | −1 | −1 |
| 2 | 250 | 30 | 15 | 10 | 1 | −1 | −1 | −1 |
| 3 | 150 | 240 | 15 | 10 | −1 | 1 | −1 | −1 |
| 4 | 250 | 240 | 15 | 10 | 1 | 1 | −1 | −1 |
| 5 | 150 | 30 | 25 | 10 | −1 | −1 | 1 | −1 |
| 6 | 250 | 30 | 25 | 10 | 1 | −1 | 1 | −1 |
| 7 | 150 | 240 | 25 | 10 | −1 | 1 | 1 | −1 |
| 8 | 250 | 240 | 25 | 10 | 1 | 1 | 1 | −1 |
| 9 | 150 | 30 | 15 | 20 | −1 | −1 | −1 | 1 |
| 10 | 250 | 30 | 15 | 20 | 1 | −1 | −1 | 1 |
| 11 | 150 | 240 | 15 | 20 | −1 | 1 | −1 | 1 |
| 12 | 250 | 240 | 15 | 20 | 1 | 1 | −1 | 1 |
| 13 | 150 | 30 | 25 | 20 | −1 | −1 | 1 | 1 |
| 14 | 250 | 30 | 25 | 20 | 1 | −1 | 1 | 1 |
| 15 | 150 | 240 | 25 | 20 | −1 | 1 | 1 | 1 |
| 16 | 250 | 240 | 25 | 20 | 1 | 1 | 1 | 1 |
| 17 | 150 | 135 | 20 | 15 | −1 | 0 | 0 | 0 |
| 18 | 250 | 135 | 20 | 15 | 1 | 0 | 0 | 0 |
| 19 | 200 | 30 | 20 | 15 | 0 | −1 | 0 | 0 |
| 20 | 200 | 240 | 20 | 15 | 0 | 1 | 0 | 0 |
| 21 | 200 | 135 | 15 | 15 | 0 | 0 | −1 | 0 |
| 22 | 200 | 135 | 25 | 15 | 0 | 0 | 1 | 0 |
| 23 | 200 | 135 | 20 | 10 | 0 | 0 | 0 | −1 |
| 24 | 200 | 135 | 20 | 20 | 0 | 0 | 0 | 1 |
| 25 | 200 | 135 | 20 | 15 | 0 | 0 | 0 | 0 |
| 26 | 200 | 135 | 20 | 15 | 0 | 0 | 0 | 0 |
| 27 | 200 | 135 | 20 | 15 | 0 | 0 | 0 | 0 |
| 28 | 200 | 135 | 20 | 15 | 0 | 0 | 0 | 0 |
| 29 | 200 | 135 | 20 | 15 | 0 | 0 | 0 | 0 |
| 30 | 200 | 135 | 20 | 15 | 0 | 0 | 0 | 0 |
| 31 | 200 | 135 | 20 | 15 | 0 | 0 | 0 | 0 |
| 32 | 150 | 30 | 15 | 10 | −1 | −1 | −1 | −1 |
| 33 | 250 | 30 | 15 | 10 | 1 | −1 | −1 | −1 |
| 34 | 150 | 240 | 15 | 10 | −1 | 1 | −1 | −1 |
| 35 | 250 | 240 | 15 | 10 | 1 | 1 | −1 | −1 |
| 36 | 150 | 30 | 25 | 10 | −1 | −1 | 1 | −1 |
| 37 | 250 | 30 | 25 | 10 | 1 | −1 | 1 | −1 |
| 38 | 150 | 240 | 25 | 10 | −1 | 1 | 1 | −1 |
| 39 | 250 | 240 | 25 | 10 | 1 | 1 | 1 | −1 |
| 40 | 150 | 30 | 15 | 20 | −1 | −1 | −1 | 1 |
| 41 | 250 | 30 | 15 | 20 | 1 | −1 | −1 | 1 |
| 42 | 150 | 240 | 15 | 20 | −1 | 1 | −1 | 1 |
| 43 | 250 | 240 | 15 | 20 | 1 | 1 | −1 | 1 |
| 44 | 150 | 30 | 25 | 20 | −1 | −1 | 1 | 1 |
| 45 | 250 | 30 | 25 | 20 | 1 | −1 | 1 | 1 |
| 46 | 150 | 240 | 25 | 20 | −1 | 1 | 1 | 1 |
| 47 | 250 | 240 | 25 | 20 | 1 | 1 | 1 | 1 |
| 48 | 150 | 135 | 20 | 15 | −1 | 0 | 0 | 0 |
| 49 | 250 | 135 | 20 | 15 | 1 | 0 | 0 | 0 |
| 50 | 200 | 30 | 20 | 15 | 0 | −1 | 0 | 0 |
| 51 | 200 | 240 | 20 | 15 | 0 | 1 | 0 | 0 |
| 52 | 200 | 135 | 15 | 15 | 0 | 0 | −1 | 0 |
| 53 | 200 | 135 | 25 | 15 | 0 | 0 | 1 | 0 |
| 54 | 200 | 135 | 20 | 10 | 0 | 0 | 0 | −1 |
| 55 | 200 | 135 | 20 | 20 | 0 | 0 | 0 | 1 |
| 56 | 200 | 135 | 20 | 15 | 0 | 0 | 0 | 0 |
| 57 | 200 | 135 | 20 | 15 | 0 | 0 | 0 | 0 |
| 58 | 200 | 135 | 20 | 15 | 0 | 0 | 0 | 0 |
| 59 | 200 | 135 | 20 | 15 | 0 | 0 | 0 | 0 |
| 60 | 200 | 135 | 20 | 15 | 0 | 0 | 0 | 0 |
| 61 | 200 | 135 | 20 | 15 | 0 | 0 | 0 | 0 |
| 62 | 200 | 135 | 20 | 15 | 0 | 0 | 0 | 0 |
Moisture content analysis
Moisture contents of the coconut samples were determined using an infrared moisture analyzer (MAC 50, Radwag, Poland). Five grams of fresh sample was placed in the tray of the drier, and the drier was operated at 110°C temperature. The results were recorded as %moisture content.
Water activity (aw) analysis
A water activity analyzer (WaterLab, Steroglass S.r.l., Italy) was used to determine the water activities of the samples. Samples were weighed at about approximately 1 g, and all measurements were carried out at 25±1°C temperature.
pH analysis
pH values of the samples were analyzed using a desktop-type pH meter (MI 151, Milwaukee Instruments Inc., U.S.A) which was calibrated daily using pH buffers at pH values of 4.01, 7.01, and 10.01. Samples were weighed in appropriate amounts and diluted using distilled water at 1:10 (w/v) proportion. Measurements were carried out at controlled temperature (25°C), and a continuous stirring was provided by a magnetic stirrer (TM12, Thermomac).
Titratable acidity analysis
Acidities of the samples were determined titrimetrically. Approximately 1 g of the sample was transferred to a glass erlenmeyer and introduced with 50 mL of ethanol. After sufficient mixing, 0.5 mL of phenolphthalein solution (0.1%, w/v) was added. Titration was performed by using 0.1 N NaOH solution, and the acidity was calculated according to Equation 1.
Total phenolic content (TPC) analysis
TPC analyses of the samples were conducted using Folin–Ciocalteu reagent as described in the method by Singleton et al. (1999). Briefly, the phenolics in 1 g of sample were extracted by methanol:water mixture (1:1, v/v) and centrifuged at 7000 rpm for 5 min by using a refrigerated centrifuge (Z 326 K, Hermle Labortechnik GmbH, Wehingen, Germany). Then, 1 mL of the extract was mixed separately with 8.25 mL of water, 0.5 mL of Folin–Ciocalteu reagent, and 0.25 mL of sodium carbonate solution (20%, w/v), and the mixtures were kept at dark for 30 min. The absorbance values of the samples were read at 760 nm wavelength in a UV-Vis spectrophotometer (V-730, Jasco Inc., Easton, MD). The external calibration was performed using the calibration curve prepared with varying concentrations of gallic acid solutions from 100 to 500 mg/kg prepared with methanol. A good fit was obtained (R2= 0.9907), and the results were expressed as mg gallic acid equivalent (GAE)/g extract.
Color analysis
Color values of the samples were measured by a portable colorimeter (NR100, 3nh Technology Co. Ltd., China), and results were expressed in CIE L*a*b* color space. The light source was D65, and the illumination angle was 8°. The aperture used for coconut samples had a diameter of 8mm (Φ8). Five measurements were recorded and average values were used to evaluate the color of the samples. ΔE* color difference values were calculated according to Equation 2.
where (∆L*) = L*sample – L*control; (∆a*) = a*sample – a*control; (∆b*) = b*sample – b*control
Fourier Transform Infrared (FTIR) spectrum analysis
FTIR spectrums of the samples were analyzed by using a FTIR spectrometer (Alpha II, Bruker, U.S.A.) equipped with an attenuated total reflectance (ATR) unit to determine the effects of drying on specific chemical bonds of the dried coconut samples. A background setup was performed prior to the measurements, and then transmittance values of the samples were recorded between 400 and 4000 cm-1 wavenumber.
Total fat content and fatty acid composition analyses
The total fat content and fatty acid composition analyses were performed on fresh coconut sample weighing approximately 5±0.01 g. Soxhlet extraction was performed to determine the total fat content. After extraction, residual solvent was removed by using a vacuum oven (WF-HTV25, Weightlab Instruments). The percentages of the amount of oil extracted was expressed in both dry and wet bases.
The fatty acid composition of the extracted coconut oil was analyzed by using GC-FID (GC-2010 Pro, Shimadzu, Japan) equipped with a AOC-20i Plus (Shimadzu, Japan) automatic injection system. Prior to injection, methyl derivates of coconut oil were prepared according to the official ISO 12966-2:2017 (ISO, 2017) method with small modifications. Briefly, 0.1 g of the sample was weighed into a test tube, and introduced with 10 mL n-hexane. After vigorous shaking, 0.5 mL of 2 N potassium hydroxide solution in methanol (met-KOH) was added, and the mixture was kept at a dark place for 1 h. Top layer of the mixture was then transferred to glass vials and injected under the following analysis conditions:
-
Column: InertCap 5MS/Sil (30 m × 0,25 mm I.D. × 0,25 µm film thickness)
-
Injection volume: 1 mL
-
Split/splitless: Split mode (1:40)
-
Column flow rate: 1 mL/min
-
Injection temperature: 280°C
-
Column temperature: Programmed (start at 80°C and hold for 3 min, ramp to 300°C by 6°C/min, hold at 300°C for 10 min)
-
Detector temperature: 300°C (flame ionization detector—FID)
-
Carrier gas: Nitrogen
The retention times of the fatty acids in the samples were co-evaluated with the retention times of 37-FAME Mix (Supelco, Germany), and the fatty acid compositions were expressed as % concentration of the total fatty acid content.
Statistical analysis and optimization
All data obtained from the experiments were analyzed using Design Expert software (v13.0.5.0, Stat-Ease Inc., U.S.A.) using coded parameters. The mathematical models were constructed, and analysis of variance (ANOVA) was applied to determine the divergencies among the samples. The models with a high lack-of-fit (LoF) value were modified and reconstructed based on their relevant R2 values until a valid LoF value was obtained, if possible. Duncan’s multiple comparison test was used to identify the differences with a confidence level of 95%. Besides, 3D surface and contour plots were built to visualize the binary effects of independent variables on the analyzed responses by using Statistica package software (Statistica v10, Statsoft Inc., Tulsa, OK).
The multiobjective optimization (MOO) was carried out using Design Expert software by co-evaluating the mathematical functions of dependent variables by taking their relevant significance levels into consideration. Regarding the findings from this study, the TPC was chosen for maximization, while moisture content and water activity values were chosen for minimization. The setup for multiobjective optimization procedure is given in Table 2.
Table 2. Setup for multiobjective optimization procedure.
| Parameters | Moisture content (%) |
Water activity | Total phenolic content (mg GAE/g) |
|---|---|---|---|
| Lower limit | – | – | 140.71 |
| Target | 1.8 | 0.283 | 209.34 |
| Upper limit | 50 | 0.988 | – |
| Importance level | +++ | +++ | ++++ |
| Starting point | |||
| x1 (Lamp power. W) | 150 | ||
| x2 (Time. min) | 30 | ||
| x3 (Lamp distance. cm) | 15 | ||
| x4 (Sample thickness. mm) | 10 |
Results and Discussion
Results of physicochemical analyses
The experimental data including moisture content (%), water activity, pH acidity (%), TPC, and color values of the coconut samples dried at different process conditions are given in Table 3.
Table 3. Experimental data of the responses.
| Process parameters | Experimental data | |||||||||||
|---|---|---|---|---|---|---|---|---|---|---|---|---|
| Moisture content (%) | Water activity (aw) | pH | Acidity (%) | Total phenolic content(mg GAE/g) | L* | a* | b* | ΔE* | ||||
| Fresh coconut | 49.28ab ±9.49 | 0.934ab ±0.01 | 6.33ab ±0.04 | 0.78a–d ±0.25 | 173.56ab ±3.73 | 54.99a–e ±0.49 | −3.85efg ±0.30 | 3.96def ±0.41 | – | |||
| x1 (W) | x2 (min) | x3 (cm) | x4 (mm) | |||||||||
| 150 | 30 | 15 | 10 | 49.50a±2.26 | 0.985a±0.016 | 6.37ab±0.02 | 0.94a–d±0.06 | 182.43ab±17.99 | 51.68c–e±2.47 | −2.68bc±0.32 | 3.81ef±0.40 | 3.52 |
| 250 | 30 | 15 | 10 | 37.59b–ef±8.58 | 0.961a±0.036 | 6.38a±0.07 | 1.27a–c±0.16 | 161.99b±0.94 | 50.25de±1.84 | −2.64b±0.35 | 3.61ef±0.45 | 4.90 |
| 150 | 240 | 15 | 10 | 17.43g±10.05 | 0.872b±0.151 | 6.20ab±0.06 | 1.05a–d±0.21 | 173.90ab±2.39 | 54.90a–e±1.03 | −2.71bc±0.13 | 6.26b±0.39 | 2.57 |
| 250 | 240 | 15 | 10 | 1.80h±1.08 | 0.283c±0.022 | 5.77c±0.04 | 1.01a–d±0.16 | 209.34a±0.21 | 39.24f±3.44 | 1.83a±0.60 | 13.20a±1.12 | 19.12 |
| 150 | 30 | 25 | 10 | 44.12a–d±5.09 | 0.956a±0.015 | 6.30ab±0.01 | 0.61d±0.00 | 165.99ab±0.36 | 53.04a–e±0.81 | −3.28b–f±0.33 | 4.89cde±0.98 | 2.24 |
| 250 | 30 | 25 | 10 | 42.06a–e±1.19 | 0.955a±0.024 | 6.42a±0.01 | 1.03a–d±0.56 | 155.34b±22.18 | 53.22a–e±3.67 | −3.14b–e±0.61 | 3.54ef±0.08 | 1.96 |
| 150 | 240 | 25 | 10 | 35.13c–f±7.89 | 0.954a±0.019 | 6.30ab±0.14 | 0.89a–d±0.27 | 148.41b±45.30 | 52.11c–e±1.89 | −2.90b–d±0.01 | 4.44d–f±1.58 | 3.08 |
| 250 | 240 | 25 | 10 | 26.64fg±1.23 | 0.916ab±0.015 | 6.20ab±0.08 | 0.97a–d±0.09 | 179.38ab±3.69 | 50.26de±7.60 | −2.64b±1.03 | 4.43d–f±0.40 | 4.91 |
| 150 | 30 | 15 | 20 | 48.70ab±2.12 | 0.971a±0.031 | 6.30ab±0.03 | 1.33ab±0.45 | 177.65ab±4.78 | 53.69a–e±1.52 | −3.10b–e±0.22 | 4.53d–f±1.28 | 1.61 |
| 250 | 30 | 15 | 20 | 44.05a–d±4.08 | 0.973a±0.018 | 6.23ab±0.14 | 1.02a–d±0.30 | 173.82ab±0.42 | 56.60a–c±1.61 | −3.49b–g±0.30 | 3.92ef±0.69 | 1.65 |
| 150 | 240 | 15 | 20 | 44.31a–d±0.95 | 0.968a±0.035 | 6.28ab±0.05 | 1.09a–d±0.34 | 185.17ab±20.00 | 55.10a–e±0.23 | −3.61c–g±0.48 | 4.10def±0.91 | 0.30 |
| 250 | 240 | 15 | 20 | 39.16a–e±8.44 | 0.970a±0.033 | 6.05b±0.01 | 0.99a–d±0.16 | 172.02ab±2.76 | 53.10a–e±1.03 | −2.60b±0.11 | 5.81bc±1.05 | 2.93 |
| 150 | 30 | 25 | 20 | 50.00a±0.17 | 0.946a±0.022 | 6.29ab±0.30 | 0.84a–d±0.28 | 161.73b±27.09 | 53.70a–e±3.73 | −3.10b–e±0.18 | 3.51f±0.48 | 1.56 |
| 250 | 30 | 25 | 20 | 45.91a–c±1.45 | 0.988a±0.007 | 6.37ab±0.15 | 1.00a–d±0.13 | 151.84b±22.57 | 49.68e±0.01 | −2.65b±0.34 | 3.39f±0.04 | 5.47 |
| 150 | 240 | 25 | 20 | 43.48a–d±7.20 | 0.938ab±0.031 | 6.30ab±0.20 | 1.10a–d±0.13 | 162.38b±20.07 | 54.81a–e±0.83 | −3.73d–g±0.37 | 4.13d–f±0.20 | 0.28 |
| 250 | 240 | 25 | 20 | 38.89a–e±0.84 | 0.959a±0.010 | 6.32ab±0.20 | 0.93a–d±0.53 | 164.58b±14.32 | 53.29a–e±3.83 | −2.89b–d±0.75 | 5.26b–d±0.38 | 2.35 |
| 150 | 135 | 20 | 15 | 43.19a–d±2.78 | 0.957a±0.024 | 6.39a±0.08 | 0.94a–d±0.56 | 157.87b±24.85 | 58.71a±1.29 | −3.87e–g±0.30 | 3.59ef±0.45 | 3.73 |
| 250 | 135 | 20 | 15 | 33.73d–f±1.03 | 0.954a±0.006 | 6.21ab±0.03 | 1.35a±0.67 | 171.03ab±1.46 | 54.87a–e±0.92 | −3.16b–e±0.16 | 4.73c–f±0.05 | 1.04 |
| 200 | 30 | 20 | 15 | 48.76ab±3.45 | 0.976a±0.001 | 6.47a±0.04 | 0.80a–d±0.06 | 140.71b±29.15 | 58.73a±1.53 | −4.10fg±0.30 | 3.66ef±0.64 | 3.76 |
| 200 | 240 | 20 | 15 | 30.50ef±6.30 | 0.966a±0.002 | 6.38a±0.06 | 0.56d±0.19 | 147.70b±37.57 | 52.36b–e±1.62 | −3.16b–e±0.11 | 3.53f±0.06 | 2.76 |
| 200 | 135 | 15 | 15 | 38.73a–e±0.07 | 0.975a±0.006 | 6.30ab±0.30 | 0.69b–d±0.01 | 165.07b±14.04 | 55.94a–d±5.63 | -3.53b–g±0.77 | 4.02d–f±0.09 | 1.01 |
| 200 | 135 | 25 | 15 | 46.47a–c±6.69 | 0.968a±0.012 | 6.42a±0.08 | 0.80a–d±0.28 | 163.57b±8.58 | 55.25a–e±2.07 | −3.44b–g±0.38 | 3.48f±0.12 | 0.68 |
| 200 | 135 | 20 | 10 | 35.68c–f±7.80 | 0.967a±0.002 | 6.33ab±0.06 | 0.65cd±0.30 | 151.83b±1.65 | 57.76a–c±2.54 | −3.79d–g±0.31 | 3.48f±0.09 | 2.81 |
| 200 | 135 | 20 | 20 | 40.07a–e±2.07 | 0.956a±0.023 | 6.45a±0.01 | 0.70b–d±0.09 | 172.25ab±7.00 | 58.32ab±0.90 | −4.30g±0.16 | 3.43f±0.10 | 3.40 |
| 200 | 135 | 20 | 15 | 41.18a–e±4.69 | 0.963a±0.016 | 6.42a±0.15 | 0.74a–d±0.14 | 157.57b±17.24 | 56.10a–d±2.03 | −3.67d–g±0.29 | 3.58ef±0.27 | 1.19 |
Results are expressed in terms of average±standard deviations. The differences between the average data having different letters within the same columns are statistically significant (p<0.05).
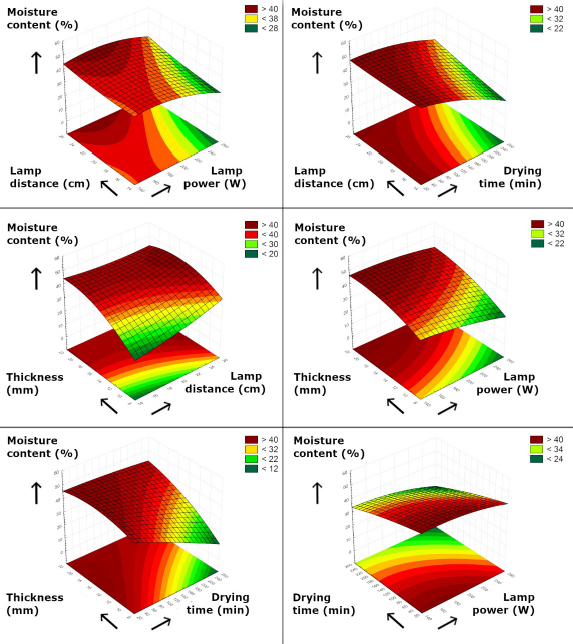
The moisture content of fresh coconut sample was 49.28±9.49%. The lowest moisture content (1.80±1.08%) was recorded in the sample dried at 250 W lamp power, 240 min time, 15 cm lamp distance, and 10 mm sample thickness conditions. The binary effects of process parameters on the moisture content are shown in Figure 2.
Figure 2. 3D plot of moisture content (%) versus drying conditions.
According to Figure 2, a decrease in moisture content was observed when both lamp power and drying time were increased. Similarly, lamp distance and sample thickness had a significant role in decreasing moisture content. As these parameters simultaneously decreased, the moisture content of the coconut was in the region of <20% because of the efficient heat transfer that resulted from the closer irradiation. Doymaz (2012) investigated infrared drying of sweet potato slices under different infrared power and sample thickness levels. In that study, it was noted that infrared power had a substantial effect on the moisture content as well as the time needed for the removal of water from the sample increased when sample thickness increased. Song et al. (2024) also stated that drying rate could be increased by decreasing radiation distance. According to Sadeghi et al. (2020), a shorter drying time could be obtained by providing higher infrared power or less thickness or lower distance in the infrared drying of pumpkin samples. Our results were in accordance with those previously published data.
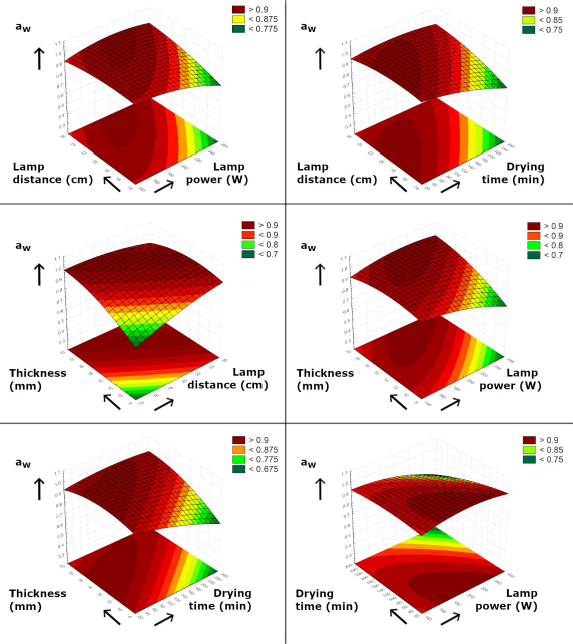
The lowest water activity (aw) value of the coconut samples was 0.283±0.022 belonging to the most intensively dried sample (250 W lamp power, 240 min time, 15 cm lamp distance, and 10 mm sample thickness), as shown in Table 3, while the aw value of fresh coconut was 0.934. Except for this sample, aw values of dried coconut samples ranged between 0.872 and 0.988. Figure 3 shows how the independent variables affected water activities of the coconuts during drying.
Figure 3. 3D plot of water activity versus drying conditions.
As shown in Figure 3, a simultaneous increase in drying time and lamp power exerted a lower aw value, which is closely related to decreasing moisture content. The higher lamp power resulted in higher temperature values which caused a decrease in aw. Also, less lamp distance and sample thickness played a similar role by creating a rapid heat transfer mechanism ending up with lower aw values. Moreover, increasing drying time in a constant lamp distance also provided lower aw values. From a technological perspective, the increased efficiency in water removal from coconut under increased power and time could be noted as a natural result of enhanced internal diffusion. This behavior is particularly relevant for coconut tissue, where bound moisture is retained within a dense matrix. Wu et al. (2019) studied the infrared drying of the Cordyceps militaris, and they stated that increasing the temperature enabled a shorter drying time of up to %60, and lower aw values were achieved with a minimum of 0.268 at 70°C–2m/s drying condition. In a study by Noutfia et al. (2025), it was emphasized that the utilization of infrared drying significantly decreased the initial water activity values of fresh palm cultivars. Similar trends stating the decrease of aw by the utilization of infrared radiation have been also reported by other researchers (Baeghbali et al., 2020; El-Mesery et al., 2024; Łechtańska et al., 2015; Nathakaranakule et al., 2010).
According to Table 3, pH and acidity values of the dried coconut samples ranged between 5.77–6.47 and 0.56– 1.35% (lauric acid), respectively. The pH and acidity values of fresh coconut were 6.33 and 0.78% (lauric acid), respectively. The pH values of the samples did not significantly change during drying, and similarly, minor fluctuations were observed in the acidity values of the samples. Figure 4 presents the effects of binary effects of independent process variables on the pH values of the dried samples.
Figure 4. 3D plot of pH versus drying conditions.
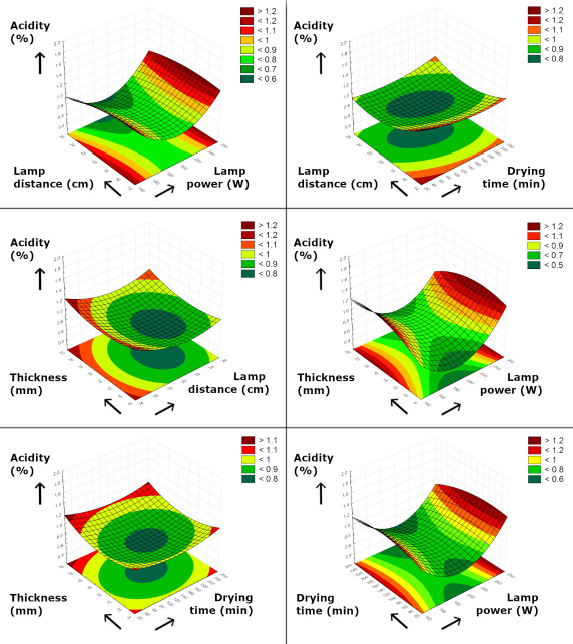
According to Figure 4, longer drying duration under constant lamp power caused a decrease in pH, as well as higher lamp power versus constant lamp distance or sample thickness also generated lower pH values. This was because higher temperatures were achieved at higher lamp power levels, which caused more evaporation of water resulting in a more concentrated medium. In a study by Baldeón et al. (2025), researchers stated that the pH values of cacao bean samples obtained by both infrared-assisted solar (IR-S) and hot-air infrared- assisted solar (HA-IR-S) were found to be lower than the nondried fermented cacao beans, which partially supports the findings in our study. A similar trend was also observed by Younis et al. (2024), who reported a decrease in pH values of Sukkari date powder at increasing infrared intensities. According to the researchers, the changes in pH could be also related to the Maillard reaction at higher temperatures, as well as some acid loss during evaporation which directly affected pH values of the samples. The changes in acidity values of the dried samples are visualized in Figure 5 under different drying conditions.
Figure 5. 3D plot of acidity (%) versus drying conditions.
According to Figure 5, the acidity values of the samples were primarily affected by lamp power; however, lamp distance, sample thickness, and drying time did not significantly cause a change in acidity. It was observed that lower acidity values were achieved when lamp distance was increased in a constant sample thickness. When lamp distance was kept at 14–18 cm from the sample, a slight decrease followed by a slight increment was observed in the acidity values. Noutfia et al. (2025) reported slightly lower but statistically insignificant changes in acidity values of infrared-dried date palm cultivars. Besides, they stated that there was an inverse correlation between pH and acidity, and they were not affected by infrared drying which also supported the case in our study. In Table 3, it can be noted that the highest acidity value was observed when the highest infrared lamp power was utilized. This can be explained by the formation of free fatty acids via triglyceride degradation at high temperatures, which was also stated by Pandiselvam et al. (2024).
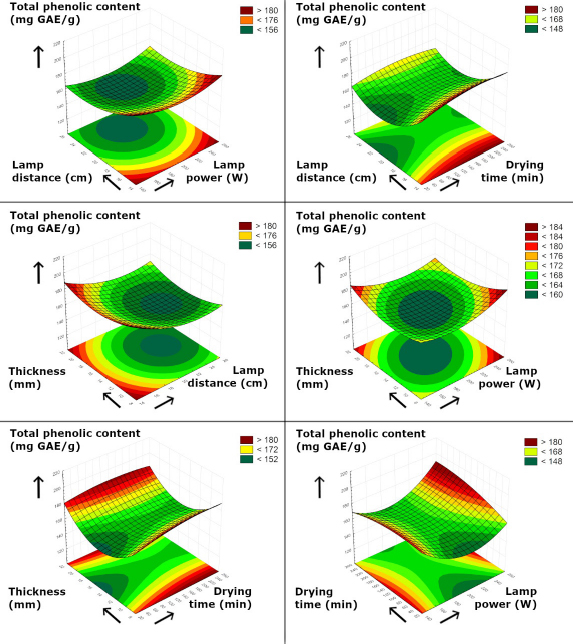
The TPC of coconut samples are given in Table 3. The TPC of fresh coconut was found to be 173.56 mg GAE/g, and the TPC of dried coconut samples ranged between 140.71 and 209.34 mg GAE/g. The highest TPC concentration was obtained when coconuts were dried under 250 W lamp power, 240 min time, 15 cm lamp distance, and 10 mm sample thickness conditions. In literature, varying TPC values have been reported because of differing phenolic concentrations in various coconut parts. For instance, Li et al. (2021) reported that the total TPCs of coconut mesocarp and coconut endocarp were 306.42±4.29 and 74.18±0.85 mg GAE/g dw, respectively. Similarly, Phonphoem et al. (2022) reported their TPC values in young coconut samples as 301.93 μg/g fresh sample for coconut meat and 150.34 μg/mL for coconut water parts. The binary effects of infrared drying conditions on the TPC values of the coconut samples are presented in Figure 6.
Figure 6. 3D plot of total phenolic content (mg GAE/g) versus drying conditions.
According to Figure 6, increasing lamp distance under constant lamp power or sample thickness caused a decrease in TPC. Also, the TPCs of the dried coconut samples were primarily affected by lamp distance, lamp power.and sample thickness; however, drying time did not exhibit a significant impact on TPC. Nguyen et al. (2024) investigated the effects of infrared drying on the properties of mango powder, and they concluded that increasing temperature could provide a better retention of TPC. In a recent study by Abhiram et al. (2023), infrared drying of Gymnema sylvestre leaves were studied and they reported an increase in TPC with longer drying durations under lower temperatures; however, TPC was decreased when the temperature levels reached to 175–200°C at higher infrared exposure times. According to Table 3, some of the infrared dried samples had higher TPC values compared to fresh coconut. This phenomenon was also reported by other researchers (Jafari et al., 2020; Onwude et al., 2019); which may be related to: (i) increased intermolecular interactions by infrared leading to higher phenolics extraction ratios and (ii) accelerated interconversion of phenolic compounds causing an undetectable compound turn into a detectable compound (Sui et al., 2014).
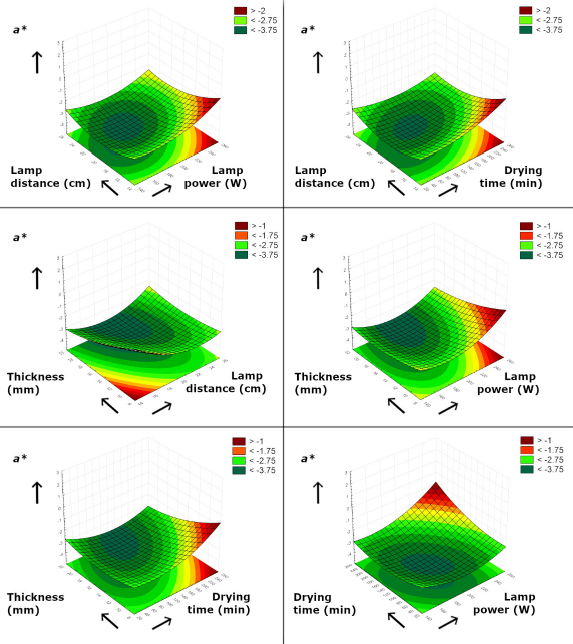
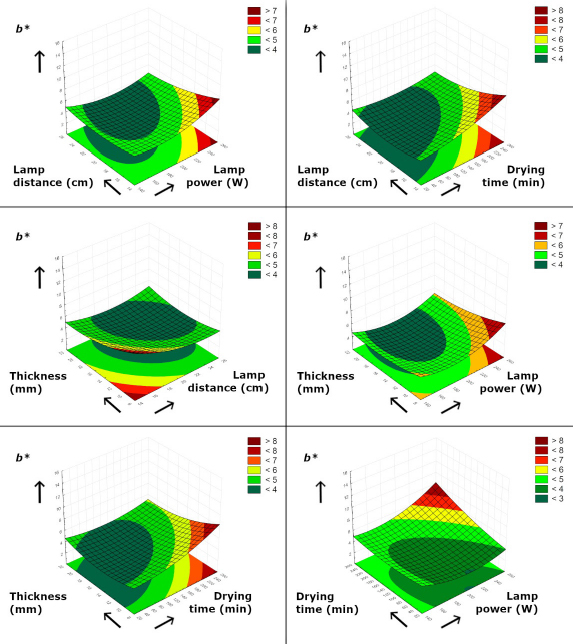
The color values of the samples are presented in Table 3, and the color was expressed in CIE L*a*b* color space in which L* (0–100) was the luminance from black (L*=0) to white (L*=100), while a* ranged from greenness (−a*) to redness (+a*) and b* ranged from blueness (−b*) to yellowness (+b*). The average L*, a*, and b* values of the fresh coconut sample were 54.99, −3.85, and 3.96, respectively. The darkest dried coconut sample had the lowest L* value of 39.24±3.44 under the most intense drying condition (250 W, 240 min, 15 cm, 10 mm), which was directly related to the browning of the sample via Maillard reaction under excessive irradiation. As expected, this sample had a high yellowness (b*=13.20±1.12) and redness value (a*=1.83±0.60), while all other samples tend to have lighter tones. The total color differences (ΔE*) of dried samples as a comparable value to the fresh coconut ranged between 0.28 and 19.12, and the highest ΔE* belonged to the most irradiated sample. The effects of drying parameters on L*, a*, and b* values are visualized in Figures 7, 8, and 9, respectively.
Figure 7. 3D plot of L* versus drying conditions.
Figure 8. 3D plot of a* versus drying conditions.
Figure 9. 3D plot of b* versus drying conditions.
An increase in lamp power clearly resulted in lower L* values and thus, darker samples were obtained. Similarly, shorter drying times achieved a brighter product having a closer color to the fresh sample. Also, thicker samples had higher L* values because of weaker heat transfer rate. The ranges for a* and b* values of dried coconuts were −4.30–1.83 and 3.39–13.20, respectively. As it can be seen in the figures, a simultaneous increase in lamp power and drying time steeply increased a* and b* values, resulting in a brownish sample. In addition, lower lamp distance and sample thickness levels also had the same effect as the lamp power increased togetherly. Higher b* values and so, yellow color was more developed under longer drying time, higher lamp power, shorter lamp distance, and lower sample thickness levels. It could be clearly stated that, while higher TPC levels could be obtained through moisture removal and potential release of bound compounds, an intense infrared drying inevitably promoted nonenzymatic browning reactions resulting in a darker color. The balance between bioactive component retention and visual appearance should be carefully established in terms of being more or less aggressive in infrared exposure. The effect of infrared on the color attribute of dried material has been previously investigated by many researchers. Abhiram et al. (2023) reported that their ΔE* value ranged between 1.4 and 23.1, and the increase of temperature and time resulted in higher ΔE*. Chang et al. (2022) noted that L* values and ΔE* color differences of cantaloupe samples was significantly affected by infrared radiation temperature and sample thickness. Under high temperature and less sample thickness conditions, their samples darkened by having lower L* values, and higher ΔE* values were achieved. Wu et al. (2019) also reported lower L* values under increasing infrared drying temperatures. At 1 m/s air velocity, their highest L* value of Cordyceps militaris sample dried at 40°C was 58.79, and it significantly dropped down to 49.58 when the temperature increased to 70°C. In another study by Younis et al. (2024), the authors reported an increase in their ΔE* value when the radiation intensity was increased, and they observed that their samples became browner. Zhu et al. (2024) compared the effects of four drying methods on the physicochemical properties of chicken meat. According to their results, ΔE* values were found to be higher in samples dried with catalytic infrared drying and electric infrared drying when compared to hot air drying, and the authors stated that these two methods achieved better color results. The authors also noted that the L*, a*, and b* values of fresh chicken meat were lower than other groups because of moisture and myoglobin content of the fresh sample. In another study by Junqueira et al. (2024), an opposite conclusion was asserted, as their L* and a* values of infrared-dried canjiqueira fruits were not significantly affected by infrared drying temperature. However, they noted that these parameters were found to be higher in dried samples when compared to those of fresh fruit. It can be concluded that our results are in accordance with the reported literature.
Results of fatty acid composition and FTIR spectrum
Depending on the variety, several reports reveal the high total fat content of fresh coconut meat such as 55–65% (Bhatnagar et al., 2009), 35.01–38.28% (Adoyo et al., 2021), and 27.69–31.99% (Ngampeerapong & Chavasit, 2019). Cocounut oil mainly consists of lauric acid (C12:0) followed by myristic acid (C14:0) with a total of 65−70%. Also, the majority of fatty acids in coconut oil is reported as medium-chain fatty acids (MCFA) including C6:0, C8:0, C10:0, and C12:0 fatty acids having a concentration of approximately 60% of the total composition (Adoyo et al., 2021; Bhatnagar et al., 2009; Ngampeerapong & Chavasit, 2019). In our study, the total fat contents of fresh coconut in wet and dry bases were determined as 45.02% and 45.30%, respectively, with an average of 45.16±0,2% (w/w). The fatty acid composition of coconut oil is presented in Table 4. According to Table 4, the major fatty acid of coconut was lauric acid with a percentage of 49.78%, followed by myristic and caprylic acids at 19.95% and 8.30%, respctively. The sum of MCFA (ΣMCFA) was determined as 64.19%, which was in accordance with literature data. Also, total mono-un-saturated fatty acids (ΣMUFA) and total saturated fatty acids (ΣSFA) were present in fresh coconut at 4.66% and 94.72% concentrations, respectively. Since infrared drying is a technique that has water removal as its main goal, fatty acid analysis was conducted only on fresh coconut samples, and the presented fatty acid composition data of fresh coconut (Table 4) should be interpreted as a baseline compositional data.
Table 4. Fatty acid composition of fresh coconut.
| Fatty acid | (%) |
|---|---|
| C6:0 (Caproic acid) | 0.59 |
| C8:0 (Caprylic acid) | 8.30 |
| C10:0 (Capric acid) | 5.52 |
| C12:0 (Lauric acid) | 49.78 |
| C14:0 (Myristic acid) | 19.95 |
| C16:0 (Palmitic acid) | 7.21 |
| C17:1 (Heptadecenoic acid) | 0.01 |
| C17:0 (Heptadecanoic acid) | 0.01 |
| C18:2 (Linoleic acid) | 0.62 |
| C18:1 (Oleic acid) | 4.65 |
| C18:0 (Stearic acid) | 3.25 |
| C20:0 (Arachidic acid) | 0.08 |
| C22:0 (Behenic acid) | 0.02 |
| C24:0 (Lignoceric acid) | 0.03 |
| ΣMCFA | 64.19 |
| ΣMUFA | 4.66 |
| ΣSFA | 94.72 |
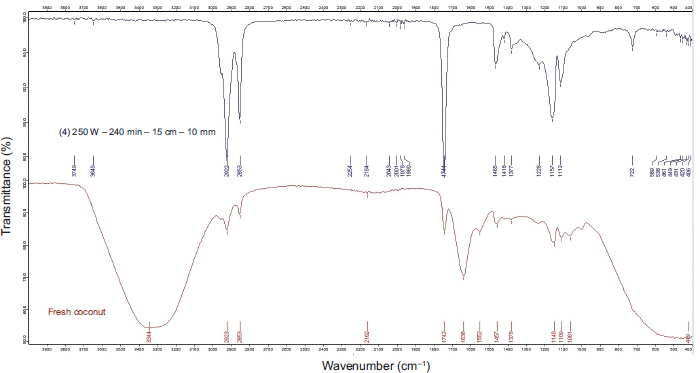
FTIR spectroscopy is known to be an efficient technique to determine the changes in the chemical bonds between components and to analyze functional groups, which enables the detection of some components that are not detectable with other techniques by using FTIR wavenumbers (Saji et al., 2024). A sample FTIR spectrum revealing the differences between the most intensively dried and fresh coconut samples is shown in Figure 10. In a typical FTIR spectrum, the peaks in the region of ~3300 and ~1630 cm−1 are characterized by infrared absorption of water (Tao et al., 2023). According to Figure 10, fresh coconut had strong peaks at 3344 and 1638 cm−1 corresponding to, respectively, O–H stretching and H–O–H bending vibrations associated with water molecules because of its high water content. In contrast, these bands were significantly weaker in dried coconut samples because of the substantial removal of water during the drying process. These changes were in accordance with the experimental data which showed a significant decrease in moisture content from 49.28% to 1.80% and a reduction in aw from 0.934 to 0.283 after drying. The C=O group stretching vibration of ester functional groups present in triglycerides at approximately ~1744 cm−1 was much stronger in the dried sample, suggesting the formation of free carboxylic acid groups, which was in good agreement with the experimentally observed increase in acidity from 0.78% to 1.01% and thus, a resulting decrease in pH from 6.33 to 5.77.
Figure 10. A sample FTIR spectrum of dried and fresh sample.
Regarding phenolic content, the increase in TPC from 173.56 to 209.34 mg GAE/g was also supported by FTIR spectrum, particularly the increased relative intensity of bands in the ~1200–1000 cm–1 region, indicating C–O stretching vibrations of phenolic compounds. It can be concluded that the higher values in phenolic content was likely because of a concentration effect caused by the removal of water from the fruit, as well as the improved extraction yield of phenolic compounds because of the disruption of plant cell matrices during drying.
Statistical evaluation and multiobjective optimization
The findings of variance analysis (ANOVA) from chemical and color attributes are presented in Table 5. According to Table 5, the p-values for models were all below 0.05, indicating that all models belonging to chemical attributes were statistically significant. For moisture content and water activity, the linear effects of variables were all significant. The linear effect of sample thickness was found to be insignificant (p>0.05) for pH, acidity, and TPC. Regarding TPC analysis, only lamp distance exhibited significant effects (p=0.0074), while none of the linear regressions were important for acidity analysis. The lack of fit (LoF) values were found to be insignificant for chemical analyses except water activity, as higher LoF values (p>0.05) demonstrated that the models were suitable in fitting to the experimental data.
Table 5. Variance analysis (ANOVA) results of the dried coconut samples.
| Response | Moisture content | Water activity | pH | Acidity | Total phenolic content | L* | a* | b* | ||||||||
|---|---|---|---|---|---|---|---|---|---|---|---|---|---|---|---|---|
| Source | F | p | F | p | F | p | F | p | F | p | F | p | F | p | F | p |
| Model | 13.55 | <0.0001 | 7.55 | <0.0001 | 4.82 | <0.0001 | 2.43 | 0.0116 | 1.92 | 0.0480 | 7.45 | <0.0001 | 10.92 | <0.0001 | 26.42 | <0.0001 |
| A-Lamp power | 17.62 | 0.0001 | 6.16 | 0.0167 | 4.13 | 0.0477 | 1.06 | 0.3074 | 0.2023 | 0.6549 | 13.49 | 0.0006 | 18.22 | <0.0001 | 23.20 | <0.0001 |
| B-Drying time | 71.90 | <0.0001 | 14.10 | 0.0005 | 12.24 | 0.0010 | 0.1261 | 0.7241 | 1.82 | 0.1843 | 6.66 | 0.0133 | 10.52 | 0.0022 | 0.0467 | 0.8299 |
| C-Lamp distance | 10.69 | 0.0020 | 6.97 | 0.0112 | 7.47 | 0.0088 | 2.74 | 0.1046 | 7.83 | 0.0074 | 0.4264 | 0.5172 | 8.74 | 0.0048 | 0.8062 | 0.3745 |
| D-Sample thickness | 44.23 | <0.0001 | 12.07 | 0.0011 | 0.7594 | 0.3880 | 0.5939 | 0.4448 | 0.0182 | 0.8933 | 12.15 | 0.0011 | 17.91 | 0.0001 | 0.0056 | 0.9407 |
| AB | 0.5652 | 0.4559 | 7.78 | 0.0076 | 6.08 | 0.0174 | 1.36 | 0.2496 | 4.03 | 0.0504 | 7.14 | 0.0105 | 14.59 | 0.0004 | 50.64 | <0.0001 |
| AC | 1.49 | 0.2278 | 8.10 | 0.0065 | 5.40 | 0.0245 | 0.7274 | 0.3980 | 0.0856 | 0.7712 | 1.65 | 0.2063 | 4.36 | 0.0422 | 22.93 | <0.0001 |
| AD | 1.75 | 0.1923 | 10.40 | 0.0023 | 0.3138 | 0.5780 | 2.96 | 0.0920 | 1.44 | 0.2358 | 4.09 | 0.0494 | 3.31 | 0.0751 | 3.82 | 0.0575 |
| BC | 6.98 | 0.0112 | 10.45 | 0.0022 | 4.41 | 0.0411 | 1.36 | 0.2496 | 0.2448 | 0.6231 | 2.34 | 0.1334 | 8.17 | 0.0063 | 39.02 | <0.0001 |
| BD | 21.94 | <0.0001 | 12.54 | 0.0009 | 4.53 | 0.0386 | 0.0455 | 0.8321 | 0.2743 | 0.6030 | 4.19 | 0.0467 | 12.07 | 0.0011 | 24.76 | <0.0001 |
| CD | 7.12 | 0.0104 | 10.78 | 0.0019 | 0.0635 | 0.8021 | 0.0891 | 0.7666 | 0.0433 | 0.8360 | 7.83 | 0.0076 | 13.60 | 0.0006 | 19.78 | <0.0001 |
| A2 | 0.6704 | 0.4170 | 0.4592 | 0.5013 | 3.73 | 0.0596 | 13.23 | 0.0007 | 1.38 | 0.2454 | 0.4746 | 0.4945 | 2.62 | 0.1123 | 10.04 | 0.0029 |
| B2 | 0.0959 | 0.7581 | 0.0551 | 0.8155 | 0.0788 | 0.7802 | 0.3588 | 0.5521 | 2.06 | 0.1576 | 3.58 | 0.0652 | 1.38 | 0.2455 | 0.8391 | 0.3650 |
| C2 | 0.9648 | 0.3310 | 0.0466 | 0.8301 | 0.7964 | 0.3767 | 0.0000 | 0.9971 | 1.35 | 0.2520 | 3.40 | 0.0721 | 3.01 | 0.0895 | 2.34 | 0.1334 |
| D2 | 1.15 | 0.2899 | 0.2635 | 0.6101 | 0.1569 | 0.6938 | 0.4158 | 0.5222 | 0.7493 | 0.3911 | – | – | 0.1846 | 0.6694 | – | – |
| ABC | – | – | – | – | – | – | – | – | – | – | 7.88 | 0.0074 | – | – | 15.96 | 0.0003 |
| ABD | – | – | – | – | – | – | – | – | – | – | 3.93 | 0.0537 | – | – | 8.55 | 0.0056 |
| ACD | – | – | – | – | – | – | – | – | – | – | 9.79 | 0.0031 | – | – | 21.87 | <0.0001 |
| BCD | – | – | – | – | – | – | – | – | – | – | – | – | – | – | 55.52 | <0.0001 |
| A2B | – | – | – | – | – | – | – | – | – | – | 4.00 | 0.0516 | – | – | – | – |
| B2C | – | – | – | – | – | – | – | – | – | – | – | – | – | – | 2.09 | 0.1560 |
| B2D | – | – | – | – | – | – | – | – | – | – | – | – | – | – | 3.18 | 0.0821 |
| BC2 | – | – | – | – | – | – | – | – | – | – | – | – | – | – | 11.65 | 0.0015 |
| Lack of Fit (LoF) | 1.75 | 0.1049 | 26.17 | <0.0001 | 0.4600 | 0.9049 | 0.5249 | 0.8614 | 0.7294 | 0.6922 | 0.6975 | 0.6738 | 7.27 | <0.0001 | 2.42 | 0.0656 |
Regarding color data, the models created for color values were all statistically significant as their p-values were below significance level (p<0.05). The linear effect of lamp power was found to be important for L*, a*, and b* values. Lamp distance did not exhibit important effects on L* parameter (p>0.05), while linear effects of all factors except lamp power were found as statistically insignificant for b* value. For a* value, all linear effects were significant, while the LoF values for L* and b* were not important (p>0.05), indicating a good fit of model to experimental data. All mathematical models are presented in Table 6.
Table 6. Generated mathematical models for responses.*
| Response | Model** | Degree |
|---|---|---|
| Moisture content (%) | +40.79-3.67A-7.41B+2.86C+5.81D-0.6968AB+1.13AC+1.2 3AD+2.45BC+4.34BD-2.47CD-1.88A2-0.7128B2+2.26C2-2.46D2 | Quadratic |
| Water activity (aw) | +0.9701-0.0325A-0.0493B+0.0346C+0.0456D-0.0388AB+0.0396A C+0.0449AD+0.0450BC+0.0493BD-0.0457CD-0.0234A2-0.0081B2-0.0075C2-0.0177D2 | Quadratic |
| pH | +6.41-0.0428A-0.0736B+0.0575C+0.0183D-0.0550AB+0.0519AC +0.0125AD+0.0469BC+0.0475BD-0.0056CD-0.1069A2+0.0156B2-0.0494C2-0.0219D2 | Quadratic |
| Acidity (%) | +0.7417+0.0428A-0.0147B-0.0686C+0.0319D-0.0513AB+ 0.0375AC-0.0756AD+0.0513BC-0.0094BD+0.0131CD+0.3971A2-0.0654B2-0.0004C2-0.0704D2 |
Quadratic |
| Total phenolic content (TPC) (mg GAE/g) | +156.54+1.32A+3.97B-8.23C-0.3 969D+6.27AB+0.9130AC-3.75AD-1.54BC-1.63BD+0.6495CD+9.12A2-11.13 B2+8.99C2+6.71D2 | Quadratic |
| L* | +56.83-1.51A-3.19B+0.2689C+1.44D-1.17AB+0.5603AC+0.8828 AD+0.6678BC+0.8941BD-1.22CD-0.7133A2-1.96B2-1.91C2+1.23ABC+0.865 9ABD-1.37ACD+2.62A2B | Reduced cubic |
| a* | -3.79+0.4214A+0.3203B-0.2919C-0.4178D+0.4000AB-0.2187AC-0.1906AD-0.2994BC-0.3638BD+0.3863CD+0.4208A2+0.3058B2+0.4508C2-0. 1117D2 | Quadratic |
| b* | +3.49+0.4828A-0.0650B-0.2700C-0.0225D+0.7566AB-0.5091AC-0.2078AD-0.6641BC-0.5291BD+0.4728CD+0.7984A2+0.2309B2+0.3859C2-0. 4247ABC-0.3109ABD+0.4972ACD+0.7922BCD-0.4609B2C-0.5684B2D+1.09 BC2 | Reduced cubic |
*Models are constituted using coded factors. **A: Lamp power. B: Drying time. C: Lamp distance. D: Sample thickness
In the multiobjective optimization step, it was targeted to maximize the TPC while minimizing moisture content and aw because other chemical attributes such as pH and acidity demonstrated a narrow range, resulting in omitting out these responses from the optimization step. The optimum process conditions aiming to reach the targeted functions were determined as 250 W lamp power, 240 min drying time, 15 cm lamp distance, and 10 mm sample thickness. In this condition, the predicted moisture content, aw, and TPC were 5.923%, 0.4883, and 189.501 mg GAE/g, respectively. The overall desirability of the MOO was 0.766, indicating that the optimization procedure achieved an acceptability level of 76.6% Moreover, it should be noted that the identified optimum point already corresponded to an experimental design point, and the experimentally obtained responses were directly available as presented in Table 3 for evaluating the model predictions.
Although the optimized condition resulted in a relatively high color difference (ΔE = 19.12), this outcome should be interpreted together with other quality attributes of coconut. Increased infrared intensity and prolonged exposure are known to promote nonenzymatic browning and concentration of phenolic compounds, which explains the simultaneous increase in TPC and color darkening. Regarding market-driven food formulations with utilization of coconut such as bakery products or nutraceutical applications, visual whiteness has often less significance compared to bioactive compound retention. In this respect, the optimum point from the optimization step represented a phenolic-rich coconut product, where the observed color change was an expected and technologically justifiable consequence of enhanced bioactive preservation. Besides, it is important to note that the RSM-derived optimum did not represent a single universal solution but rather a quality-preferred scenario within the experimental design with many desirable experimental points. While the selected condition maximized phenolic preservation and minimized moisture content and aw simultaneously, experimental results indicated that alternative operating points with lower ΔE values and slightly reduced bioactive content were also available within the design space.
With respect to energy feasibility, it should be noted that the optimization in this study was primarily oriented toward product quality attributes rather than minimum energy consumption alone. While the optimized infrared drying time (240 min) might appear quite long, the greater effects of applied radiation under different drying conditions were also clearly observed. As a result, the ability of selection of power-time levels in infrared radiation allowed a range of options regarding energy input, based on specifically desired physicochemical properties.
Conclusion
This study revealed that infrared drying effectively reduced the moisture content and aw of coconuts by 96.3% and 69.7%, respectively. The pH and acidity values of the dried coconut samples ranged between 5.77–6.47 and 0.56–1.35% (lauric acid) when the values for fresh coconut were 6.33 and 0.78% (lauric acid), respectively. The highest TPC was found to be 209.34 mg GAE/g in the sample dried under 250 W lamp power, 240 min time, 15 cm lamp distance, and 10 mm sample thickness. The most intensively dried sample also had the lowest L* value, making it darker than other groups. The total color differences (ΔE*) of dried samples as a comparable value to the fresh coconut ranged between 0.28 and 19.12. The darkening of the sample was mostly related to Maillard reaction. As the infrared drying time and lamp power decreased, a brighter sample could be obtained in the final product. According to pH results, it can be concluded that stable pH values could be observed by using infrared drying. The major fatty acid of the fresh sample was lauric acid at 49.78% concentration, and the content of ΣMCFA was determined as 64.19%. The models created using RSM were found to be statistically significant, and thus, usable for the presentation of experimental data. Regarding optimization, the optimum drying condition was found to be 250 W lamp power, 240 min drying time, 15 cm lamp distance, and 10 mm sample thickness, which resulted in predicted moisture content, aw, and TPC of 5.923%, 0.4883, and 189.501 mg GAE/g, respectively, with an overall desirability of 0.766. The findings from this study are expected to advance the current literature data in terms of exploring the effects of various infrared drying conditions on the physicochemical properties of coconut via a mathematical approach for increased repeatability.
Mandatory Disclosure on Use of Artificial Intelligence
The authors declare that AI-assisted tools were used as follows: [ChatGPT, Purpose of use: Image editing and correcting minor grammatical issues]. All references have been manually verified for accuracy and relevance.
Acknowledgements
This study is the master’s thesis of Ceren BEKTAŞ. The authors would like to thank Eskişehir Osmangazi University, Scientific Research Projects Coordination Unit for their funding support.
Authors’ Contributions
Ceren Bektaş was reponsible for methodology, formal analysis, and investigation. Onur Ketenoglu was in charge of supervision, project administration, writing—original draft, conceptualization, writing—review & editing, visualization, and software.
Conflict of Interests
The authors declare no conflict of interest.
Funding
This study was funded by Eskişehir Osmangazi University, Scientific Research Projects Coordination Unit with project number FYL-2024-3094.
REFERENCES
Abhiram, G., Briyangari, A., Eeswaran, R. 2023. Drying of Gymnema sylvestre using far-infrared radiation: Antioxidant activity and optimization of drying conditions. AgriEngineering. 5(1): 611–622. 10.3390/agriengineering5010038
Adoyo, G.O., Sila, D.N., Onyango, A.N. 2021. Physico-chemical properties of kernel from coconut (Cocos nucifera L.) varieties grown at the Kenyan Coast. Afr. J. Food Sci. 15(8): 313–321. 10.5897/AJFS2021.2116
Alfiya, P.V., Jayashree, E., Theertha, K.V. 2025. Conventional sun drying and infrared convective drying of spices: A comparative evaluation on kinetics and quality. Sol. Energy. 291: 113396. 10.1016/j.solener.2025.113396
Baeghbali, V., Ngadi, M., Niakousari, M. 2020 . Effects of ultrasound and infrared assisted conductive hydro-drying, freeze-drying and oven drying on physicochemical properties of okra slices. IFSET, 63: 102313. 10.1016/j.ifset.2020.102313
Baldeón, E.O., Mamani-Olgado, L.R., Silva-Santisteban, B.O.Y.,Chire-Fajardo, G.C., Martínez-Guerrero, N.C., UreñaPeralta, M.O. 2025. Impact of hot-air and infrared-assisted solar drying on the drying characteristics and physicochemical properties of cacao beans (Theobroma cacao L.). Front. Sustain. Food Syst. 9: 1596519. 10.3389/fsufs.2025.1596519
Bhatnagar, A.S., Prasanth Kumar, P.K., Hemavathy, J., Gopala Krishna, A.G. 2009). Fatty acid composition, oxidative stability, and radical scavenging activity of vegetable oil blends with coconut oil. JAOCS 86(10): 991–999. 10.1007/s11746-009-1435-y
Chang, A., Zheng, X., Xiao, H., Yao, X., Liu, D., Li, X., Li, Y. 2022. Short-and medium-wave infrared drying of cantaloupe (Cucumis melon L.) slices: Drying kinetics and process parameter optimization. Processes. 10(1): 114. 10.3390/pr10010114
Dehghannya, J., Nabizadeh, E., Ghaffari, H. 2025. The impact of fixed wave application time on the physicochemical and microstructural characteristics of potato slices during intermittent infrared–hot air drying. LWT. 227: 118027. 10.1016/j.lwt.2025.118027
Ding, C., Chang, L., Luo, Y., Tao, T., Atungulu, G.G., Ding, H.,Huang, L., Simelane, M.B.C., Zhao, S., Liu, Q. 2023. Influence of cooking and texture attributes of far infrared radiated Japonica rice during storage. J. Cereal Sci. 112: 103710. 10.1016/j.jcs.2023.103710
Divya, P.M., Roopa, B.S., Manusha, C., Balannara, P. 2023. A concise review on oil extraction methods, nutritional and therapeutic role of coconut products. JFST. 60(2): 441–452. 10.1007/s13197-022-05352-0
Doymaz, İ. 2012. Infrared drying of sweet potato (Ipomoea batatas L.) slices. JFST. 49(6): 760–766. 10.1007/s13197-010-0217-8
El-Mesery, H.S., Hu, Z., Ashiagbor, K., Rostom, M. 2024. A study into how thickness, infrared intensity, and airflow affect drying kinetics, modeling, activation energy, and quality attributes of apple slices using infrared dryer. J. Food Sci. 89(5): 2895–2908. 10.1111/1750-3841.17064
El-Mesery, H.S., Jibril, A.N., ElMesiry, A.H., Hu, Z., Zhang, X., Mahdi, A.A. 2025. Application of numerical analysis and artificial intelligence to predict physicochemical properties of dried garlic slices (Allium sativum L.) using a microwave dryer. J. Agric. Food Res. 24: 102389. 10.1016/j.jafr.2025.102389
FAO. (2023).Food and Agriculture Organization of the United Nations. FAOSTAT Statistical Database: Crops and livestock products. https://www.fao.org/faostat/en/#data/QC [Accessed: 23 October 2025).
Glomm, W.R., Molesworth, P.P., Yesiltas, B., Slizyte, R., Mozuraityte, R., Jacobsen, C., Johnsen, H. 2026. Microencapsulation of salmon oil using fish gelatin/gum acacia complexes as wall materials for spray drying: Effect of gelatin source and processing on interfacial tension and oxidative stability. Food Hydrocoll. 171: 111859. 10.1016/j.foodhyd.2025.111859
Huang, D., Yang, P., Tang, X., Luo, L., Sunden, B. 2021. Application of infrared radiation in the drying of food products. TIFS. 110: 765–777. 10.1016/j.tifs.2021.02.039
ISO. 2017. International Organization for Standardization. Animal and vegetable fats and oils — Gas chromatography of fatty acid methyl esters–Part 2: Preparation of methyl esters of fatty acids. Method: 12966-2:2017.
Jafari, F., Movagharnejad, K., Sadeghi, E. 2020. Infrared drying effects on the quality of eggplant slices and process optimization using response surface methodology. Food Chem. 333: 127423. 10.1016/j.foodchem.2020.127423
Junqueira, J.R.de J., Balbinoti, T.C.V., Santos, A.A.L., Campos, R.P.,Miyagusku, L., Corrêa, J.L.-G. 2024. Infrared drying of canjiqueira fruit: A novel approach for powder production. Appl. Food Res. 4(2): 100645. 10.1016/j.afres.2024.100645
Łechtańska, J.M., Szadzińska, J., Kowalski, S.J. 2015. Microwave-and infrared-assisted convective drying of green pepper: Quality and energy considerations. CEP:PI. 98: 155–164. 10.1016/j.cep.2015.10.001
Li, N., Jiang, H., Yang, J., Wang, C., Wu, L., Hao, Y., Liu, Y. 2021.Characterization of phenolic compounds and anti-acetylcholinase activity of coconut shells. Food Biosci. 42: 101204. 10.1016/j.fbio.2021.101204
Lu, H., Ma, G., Wan, F., Zang, Z., Xu, Y., Wu, B., Li, L., Liu, Z., Huang, X., Dai, F. 2025. Enhancing the ultrasound-assisted hot air drying of cherry through different pretreatments: Effect on drying characteristics, physicochemical quality, microstructure, texture and sensory evaluation. Ultrason. Sonochem. 122: 107578. 10.1016/j.ultsonch.2025.107578
Nathakaranakule, A., Jaiboon, P., Soponronnarit, S. (2010). Far-infrared radiation assisted drying of longan fruit. J. Food Eng. 100(4): 662–668. 10.1016/j.jfoodeng.2010.05.016
Ngampeerapong, C., and Chavasit, V. 2019. Nutritional and bioactive compounds in coconut meat of different sources: Thailand, Indonesia and Vietnam. CMUJ. Nat. Sci. 18(4): 562–573. 10.12982/CMUJNS.2019.0037
Nguyen, P.B.D., Nguyen, T.V.L., Nguyen, T.T.D. 2024. Effect of infrared drying on the drying kinetics and the quality of mango (Mangifera indica) powder. Pol. J. Food Nutr. Sci. 74(1): 69–81. 10.31883/pjfns/182962
Noutfia, Y., Ropelewska, E., Szwejda-Grzybowska, J., MieszczakowskaFrąc, M., Siarkowski, S., Rutkowski, K. P., Konopacka, D. 2025. Effects of mild infrared and convective drying on physicochemical properties, polyphenol compounds, and image features of two date palm cultivars: ‘Mejhoul’ and ‘Boufeggous’. LWT. 218: 117502. 10.1016/j.lwt.2025.117502
Onwude, D.I., Hashim, N., Abdan, K., Janius, R., Chen, G. 2019.The effectiveness of combined infrared and hot-air drying strategies for sweet potato. J. Food Eng. 241: 75–87. 10.1016/j.jfoodeng.2018.08.008
Pandiselvam, R., Davison, S., Manikantan, M.R., Jacob, A.,Ramesh, S. V., Beegum, S. 2024. Comparative study on infrared radiation and hot air convective drying of coconut: Effect on oil quality features. TSEP. 55: 102950. 10.1016/j.tsep.2024.102950
Phonphoem, W., Sinthuvanich, C., Aramrak, A., Sirichiewsakul, S., Arikit, S., Yokthongwattana, C. 2022. Nutritional profiles, phytochemical analysis, antioxidant activity and DNA damage protection of Makapuno derived from Thai aromatic coconut. Foods. 11(23): 3912. 10.3390/foods11233912
Riadh, M.H., Ahmad, S.A.B., Marhaban, M.H., Soh, A.C. 2015. Infrared heating in food drying: An overview. Dry. Technol. 33(3): 322–335. 10.1080/07373937.2014.951124
Rosenthal, I. 1992. Infrared radiation. In Rosenthal, I. (Ed.), Electromagnetic Radiations in Food Science, Springer Berlin Heidelberg, pp. 105–114. 10.1007/978-3-642-77106-4_4
Sabbaghi, H., and Nguyen, P.N. 2025. Infrared drying in food technology: Principles and practical insights. In Chandrapala, J. (Ed.), Novel Drying Technologies in Food Science. IntechOpen, United Kingdom. 10.5772/intechopen.1009292
Sadeghi, E., Movagharnejad, K., Haghighi Asl, A. 2020. Parameters optimization and quality evaluation of mechanical properties of infrared radiation thin layer drying of pumpkin samples. J. Food Process Eng. 43(2): e13309. 10.1111/jfpe.13309
Saji, R., Ramani, A., Gandhi, K., Seth, R., Sharma, R. 2024. Application of FTIR spectroscopy in dairy products: A systematic review. Food & Humanity. 2: 100239. 10.1016/j.foohum.2024.100239
Singleton, V.L., Orthofer, R., Lamuela-Raventós, R.M. 1999. Analysis of total phenols and other oxidation substrates and antioxidants by means of folin-ciocalteu reagent. In Packer, L. (Ed.), Methods in Enzymology, Academic Press, Vol. 299, pp. 152–178. 10.1016/S0076-6879(99)99017-1
Song, J., Jin, X., Han, Y., Zhai, S., Zhang, K., Jia, W., Chen, J. 2024. Infrared drying effects on the quality of jujube and process optimization using response surface methodology. LWT. 214, 117089. 10.1016/j.lwt.2024.117089
Sui, Y., Yang, J., Ye, Q., Li, H., Wang, H. 2014. Infrared, convective, and sequential infrared and convective drying of wine grape pomace. Dry. Technol. 32(6): 686–694. 10.1080/07373937.2013.853670
Tao, T., Wang, Y., Gao, J., Yan, W., Liu, Q., Zhang, Z., Ding, C. 2023. Impact of infrared heating on drying properties and flavor components of carmine radish (Raphanus sativus L.) slices. Food Bioeng, 2(2): 164–174. 10.1002/fbe2.12044
USDA. (2023). U.S. Department of Agriculture, Agricultural Research Service. FoodData Central. Flour, coconut. https://fdc.nal.usda.gov/food-details/2515382/nutrients (Accessed: 23 October 2025).
Wang, D., Zhang, M., Ju, R., Mujumdar, A.S., Yu, D. 2023. Novel drying techniques for controlling microbial contamination in fresh food: A review. Dry. Technol. 41(2): 172–189. 10.1080/07373937.2022.2080704
Wu, X., Zhang, M., Li, Z. 2019. Influence of infrared drying on the drying kinetics, bioactive compounds and flavor of Cordyceps militaris. LWT. 111: 790–798. 10.1016/j.lwt.2019.05.108
Younis, M., Ahmed, K.A., Ahmed, I.A.M., Yehia, H.M., Abdelkarim, D.O., Elfeky, A. 2024. Influence of infrared radiation drying on the physicochemical attributes of date powder. Egypt. J. Chem. 67(10): 155–165. 10.21608/ejchem.2024.260447.9143
Zhu, R., Chen, W., Zheng, Y., Xu, R., Ma, H. 2024. Comparison of four drying methods in terms of the drying efficiency and physicochemical properties of chicken meat. Food Phys. 1: 100010. 10.1016/j.foodp.2024.100010