
Download
F C % = V 1 − V 0 V 0 × 100 1 F S % = V 2 − V 0 V 1 − V 0 × 100 2 E A % = Height of emulsified layer (cm) Height of total liquid (cm) × 100 3 E S % = (Emulsion volume t 0 -Liquid volume separated t 1 : 24 ) Emulsion volume t 0 × 100 4 EHS 80 ° C (%)= Height of remaining emulsified layer (cm) Height of total liquid cm) × 100 5
Paper
Comparison of some functional properties and protein profiles of different protein sources with egg components
Mine Köstekli Büyükcan, Sibel Karakaya*
Department of Food Engineering, Faculty of Engineering, Ege University, Bornova 35100, İzmir, Turkey
Abstract
Emulsifying and foaming properties of plant and animal-sourced proteins; wheat protein hydrolysates (WP1, WP2, and WP3), potato protein isolates (PP1, PP2), pea proteins isolates (PeP1, PeP2), whey protein concentrate (WPC), and buttermilk powder (BMP) were compared with the egg white powder (EWP) and egg yolk powder (EYP). Foaming capacity, stability, emulsion activity, stability, heat stability, morphology, and electrophoretic protein profiles were determined. The proteins representing competitive emulsifying functions were PeP1, WPC, and BMP. Heat treatment for 30 min at 80°C remarkably reduced the emulsion activity (EA) of EYP. Our findings demonstrated that patatin-rich potato protein (PP1), an allergen-free and vegan option, has great potential to replace the foaming function of the egg white. The relationship between the protein profiles of the samples and their functional properties was further discussed in detail.
Key words: dairy protein, egg replacement, emulsifying, foaming, plant protein, protein profile
*Corresponding Author: Sibel Karakaya, Department of Food Engineering, Faculty of Engineering, Ege University, Bornova, 35100 İzmir, Turkey. E-mail: sibel.karakaya@ege.edu.tr
Received: 17 April 2021; Accepted: 7 July 2021; Published: 31 July 2021
© 2021 Codon Publications
This is an Open Access article distributed under the terms of the Creative Commons Attribution-NonCommercial-ShareAlike 4.0 International (CC BY-NC-SA 4.0). License (http://creativecommons.org/licenses/by-nc-sa/4.0/)
Introduction
Proteins have critical functional properties for the food industry, such as emulsification, thickening, gelation, foaming, and water binding. Although dietary proteins are available in both plant and animal sources, in recent years, there has been increasing attention toward utilizing novel plant proteins to support human nutrition at a low cost (Ogunwolu et al., 2009; Shah et al., 2019). In addition, maintaining sustainability by balancing food production against increasing food demand and nutritional requirements is one of the most important topics, especially in developing countries (Butt and Batool, 2010). For this purpose, several studies have focused on replacements of the ingredients in formulated foods. The egg is one of the major constituents in the food industry, especially in the bakery. It brings about various techno-functional properties such as foaming, emulsifying, binding, leavening, tenderization, volume, texture, stabilization, coagulation, flavor, color, and nutritional value to the food products (Abdul Hussain and Al-Oulabi, 2009; Geera et al., 2011). However, consumers’ needs and expectations have led the food industry to focus on egg alternatives. Those needs and expectations include ethical values, allergen-free/-reduced food products, affordable prices, extended shelf life, no refrigeration requirement, and lesser microbiological concerns (Kohrs et al., 2010). Furthermore, fluctuating egg prices, consumer concerns about clean labeling, animal welfare, environment, and sustainability reveal a great need to investigate an alternative ingredient to replace egg used in food formulations (Abdul Hussain and Al-Oulabi, 2009; Jarpa-Parra, 2018; Lin et al., 2017).
Physicochemical interactions between protein and other food system components such as oil, water, air, and other proteins contribute to the functional properties of the proteins. Those functions are related to several intrinsic and extrinsic factors, namely, shape, size, amino acid content and sequence, distribution of net charges, hydrophobicity and hydrophilicity ratio, structure, solubility; interaction with other substances represent the former while pH, temperature, moisture, additives, enzymes, salt concentration, ionic strength, and extraction method is included in the latter (Butt and Batool, 2010; Ivanova et al., 2014; Shah et al., 2019). Moreover, protein concentration, oil phase volume, and processing conditions have a crucial effect on functional properties (Barać et al., 2015).
The replacement of an ingredient can be achieved by identifying the target ingredient’s functions in food matrices. Some egg replacers composed of whey protein isolates, soy compounds, wheat gluten, and several thickening agents are commercially available. They used to claim a 100% egg replacement. However, due to the unique structure of the egg and its function, such claims remain unrealistic (Geera et al., 2011).
There is an increasing demand for value-added food products with low-cost protein sources (Chandi and Sogi, 2006). Attention to sustainable and cost-optimized egg alternatives for industrial application is increasing. Current literature provides valuable data for the functions of the various proteins. However, applied methods and conditions (concentration, pH, equipment, oil phase, oil type) are diverse in the current literature. Therefore, the determination of different protein sources’ functional properties should contribute to challenging egg replacement studies. Unfortunately, different methodologies lead to limitations in comparing the results for industrial purposes. The opposite results for the same protein sample can be explained by the sample purity, isolation methods, parameters used for analyses, genotypes of the protein source, and environmental conditions (Barać et al., 2015). Therefore, as performed in this present study, examining different samples regarding their techno-functional properties by comparing egg white powder (EWP) and egg yolk powder (EYP) with a standard method in the same conditions becomes crucial.
In this study, the investigation of plant and animal-sourced proteins’ main functions was aimed at. Besides, another aim was to compare them with the egg and to present the relationship among the function and protein profiles individually.
Materials and Methods
Materials
Dr Oetker Gıda Sanayi Tic. AŞ., Turkey, kindly provided the commercial samples (WP1, WP2, WP3, PP1, PP2, PeP1, PeP2, whey protein concentrate [WPC], buttermilk powder [BMP], EWP, and EYP) and whole egg powder (WEP). The sunflower oil and the fresh eggs were supplied from a local market. All chemical reagents were analytical grade and supplied from Merck KGaA. Distilled water was used in all analyses, except for the SDS-PAGE analysis in which ultrapure water was used. Technical data provided by individual producers on a wet basis (wb) are given in Table 1.
Table 1. Technical data of the samples.
| Sample | Maximum % | General description | |
|---|---|---|---|
| Protein | Moisture | ||
| WP1 | 79 | 4.5 | Enzymatic partly hydrolyzed wheat protein |
| WP2 | 79 | 4.5 | Enzymatic partly hydrolyzed wheat protein |
| WP3 | 85 | 7 | Wet extracted and enzymatically hydrolyzed wheat protein |
| PP1 | 90.5 | 9 | Potato protein isolate |
| PP2 | 93.2 | 9 | Potato protein isolate |
| PeP1 | 79 | 7 | Pea protein isolate from yellow pea (Pisum sativum) |
| PeP2 | 81.7 | 5 | Pea protein isolate |
| WPC | 79 | 5 | Whey protein concentrate |
| BMP | 36 | 5 | Sweet buttermilk powder, evaporated and spray dried |
| EYP | 30 | 5 | Egg yolk powder, pasteurized and spray dried |
| EWP | 82 | 8 | Egg albumen powder, pasteurized and spray dried from partially de-lysozymed liquid egg white |
BMP: buttermilk powder, EWP: egg white powder, EYP: egg yolk powder, WPC: whey protein concentrate.
Determination of protein and moisture content
According to the instrument’s instruction, moisture content was determined with a halogen moisture analyzer (Mettler Toledo, HE73) in triplicates. Protein content was determined by Dumas combustion method with FP 528 Nitrogen/Protein Determinator (LECO). Samples were weighed individually to tin foil cups and analyzed in parallel. Conversion factors were 6.38 for BMP, 6.15 for WPC, 5.7 for WP1, WP2, WP3, and 6.25 for the rest of the samples.
Determination of protein profiles
The samples’ protein profiles were determined with SDS-PAGE electrophoresis (Laemmli, 1970) with Bio-Rad MiniProtean electrophoresis system and Mini Protean® TGXTM 12% separation gel. Samples were first diluted with ultrapure water to a final protein concentration of 3 mg/mL and then with a sample buffer (1:2 v/v). Diluted samples were incubated at 95°C for 5 min at 200 rpm in an Eppendorf ThermoMixer C. The gel was run at 50 V and was stained. The gel was washed with the destaining solution after staining to remove excess dye. The protein bands’ molecular weight (MW) was calculated with ImageJ (1.52a, National Institutes of Health, USA).
Determination of foaming properties
The foaming capacity was determined with the method described by Ivanova et al. (2014) with slight modifications. In brief, 100 mL protein solution (3%, w/v) was prepared in distilled water by stirring continuously with a magnetic stirrer (2mag, Magnetic emotion) and poured in a 250 mL measuring cylinder. For foam formation, a foaming apparatus (MateStar, MAT-101W) was located at the center of the measuring cylinder above a constant height and operated for 3 min. The volume after foaming (V1) was directly recorded at once. Foaming capacity (%) was calculated using the below formula.
The foam stability was defined as the foam’s ratio that remained after a certain period to the initial foam volume at room temperature. Total volume after 1 hour (h) (V2:1) and after 24 h (V2:24) at room temperature was recorded. Foam stability (%) was calculated using the below formula:
where
V0 = total volume before whipping,
V1 = total volume after whipping,
V2:1 = total volume after 1 h,
V2:1 = total volume after 24 h,
Determination of emulsifying properties
The emulsion activity was determined as described by Ivanova et al. (2014) with slight modifications. Protein solutions (2g/100 mL) were prepared in distilled water and were homogenized (Heidolph, Diax 900, 900W) for 30 seconds (sec) at 8000 rpm. Sunflower oil (100 mL) was colored with Sudan Blue II (0.15%) and added to the protein solution. Homogenization for 30 sec was applied. Immediately after homogenization, the emulsion was centrifuged (Hettich Zentrifugen Rotofix 32 A) at 1200 rpm for 5 min. Emulsion activity (%) was determined using the below formula.
The method proposed by Shen and Tang (2012) with slight modifications was used to determine ES (%). In brief, oil in water emulsion (40:60 v/v) was used. Protein solution (3%) was prepared in distilled water, and 120 g protein solution was combined with 80 g sunflower oil colored with Sudan Blue II. The mixture was homogenized (Heidolph, Diax 900, 900W) for 2 min at 11,600 rpm. Then, the emulsion was transferred into the tubes (50 mL) without taking up the foam phase. The volume of the emulsion was recorded after 1 h and 24 h. Emulsion stability (%) was calculated using the below formula.
where
Emulsion volume t0: the volume of the emulsion at the beginning (50 mL)
Liquid volume separated t1: the volume of the emulsion after 1 h; t24: the volume of the emulsion after 24 h.
Emulsion heat stability (EHS) was determined by the method proposed by Ivanova et al. (2014). Samples were prepared as described in the EA method (2.5.1). Before centrifugation, emulsions were heated in a water bath at 80°C, for 30 min. Then, the tubes were cooled to room temperature under tap water. Then the tube’s content was centrifuged at 1200 rpm for 5 min. The emulsion heat stability (%) also represented EA determined after heat treatment and was calculated as follows:
Microscopic observations of the emulsions
The microstructure was imaged with a microscope (Olympus CH20BIMF200, Olympus Optical Co., Ltd., Japan) according to Kawano et al. (2015). The emulsion preparation procedure was the same as applied in EA determination.
The emulsion droplet (6 µL) was placed on a concave glass slide immediately after emulsion preparation. The droplet was diluted with sunflower oil (60 µL) colored with Sudan Blue II dye to improve the image quality. The concave glass provided the integrity of the emulsion’s natural structure. The software Image J (1.52a, National Institutes of Health, USA) was used to perform the emulsion microstructure evaluation and diameter measurement after proper scaling settings. The emulsion droplet diameter was determined by the average of 50 different droplets from each image as triplicates.
Statistical analyses
All analyses were done in triplicates and parallels except protein content and SDS-PAGE. Protein analyses were carried out in duplicate. Experimental data were analyzed using ANOVA (SPSS for Windows Version 24.0, SPSS Inc., Chicago, IL, USA), and comparisons among the means were performed using Tukey’s test. Differences between the means were considered significant at P < 0.05. The relationship between the protein sources and the functional properties was analyzed using the Cluster Analysis and Principal Component Analysis (PCA) (trial version of XLSTAT 2020, Addinsoft).
Result and Discussion
Moisture and protein content
The protein sources used in this study were hydrolyzed proteins (WP1, WP2, WP3), protein isolates (PP1, PP2, PeP1, PeP2), protein concentrate (WPC), and spray-dried powders (BMP, EYP, EWP). The highest protein content was found in PP2, 91.70% (P < 0.05), which was followed by PP1 (89.52%) (Table 2). EYP exhibited the lowest protein content (32.47%). In general, protein and moisture content agreed with the technical product specification values. The moisture content of WP1, WP2, and PeP2 was slightly higher than the values reported in the technical product specification. The moisture absorption during storage can be the reason for this. Total protein content, protein solubility, and moisture content of the proteins have critical importance on the functional properties by affecting the amount of protein adsorbed at the interface.
Table 2. Protein and moisture contents of samples.
| Sample | Protein (%) | Moisture (%) |
|---|---|---|
| PP1 | 89.52 ± 0.43b | 7.37 ± 0.30c |
| PP2 | 91.70 ± 0.13a | 8.17 ± 0.22b |
| WP1 | 76.09 ± 0.12f | 7.28 ± 0.50c |
| WP2 | 76.79 ± 0.06e,f | 6.96 ± 0.17c |
| WP3 | 77.38 ± 0.25e | 5.49 ± 0.07d |
| PeP1 | 78.69 ± 0.04d | 8.04 ± 0.23b |
| PeP2 | 80.39 ± 0.18c | 8.76 ± 0.24a |
| WPC | 81.38 ± 0.19c | 5.74 ± 0.01d |
| BMP | 36.27 ± 0.00g | 3.93 ± 0.21e |
Values were given as mean ± standard deviation (n = 6). a–h Different letters in the same column represent statistical significance (P < 0.05)
BMP: buttermilk powder, WPC: whey protein concentrate.
Protein profiles
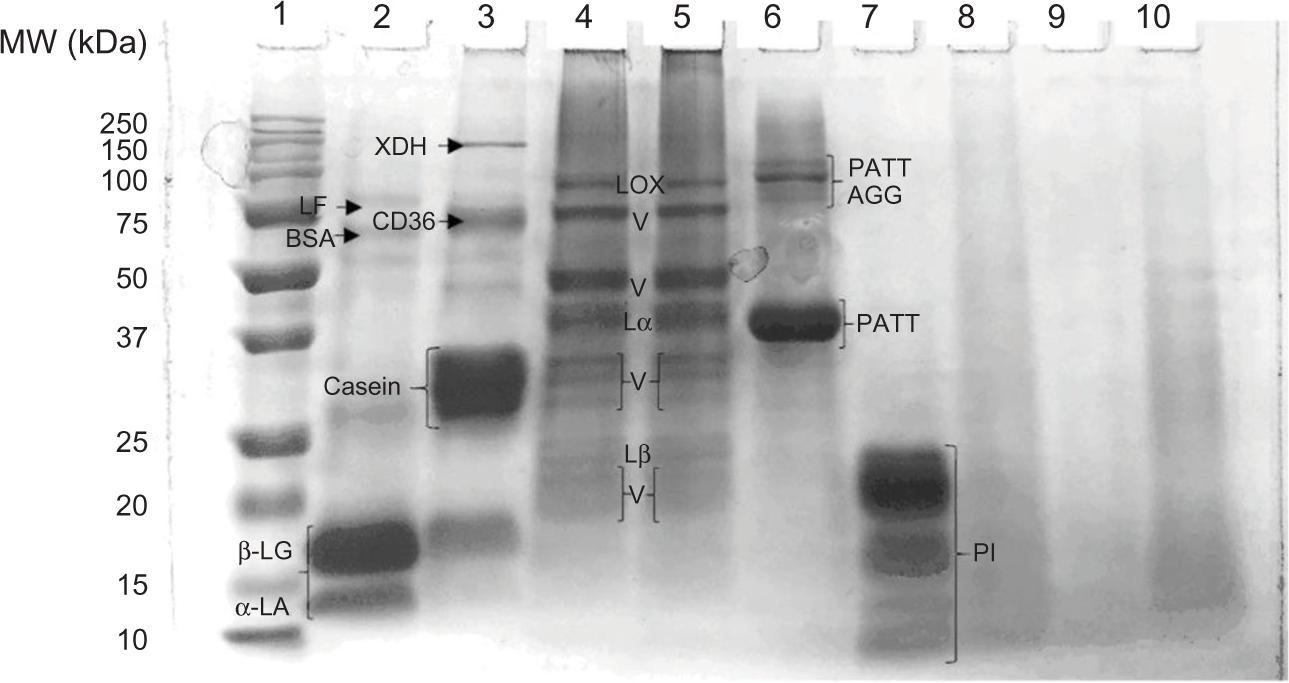
Protein profiles of the samples were represented in Figures 1 and 2. MW of protein bands obtained for WPC (Lane 2) were compared with the existing literature (Jiménez et al., 2012) and referred to as lactoferrin (LF, 80 kDa), bovine serum albumin (BSA, 66 kDa), β-lactoglobulin (β-LG, 18 kDa), and α-lactalbumin (α-LA, 14 kDa). In terms of functional properties, major WPC proteins, namely, β-LG and α-LA, were described as the most basic fractions to use in food applications (Svanborg et al., 2015). β-Lactoglobulin and α-LA are both small globular proteins, and β-LG contains two disulfide bridges and a free thiol group while α-LA contains four disulfide bridges (Soltani et al., 2017). The sulfur content and surface hydrophobicity of main whey proteins are essential for their functional properties (Abd El-Salam et al., 2009). The bands with high MW obtained for BMP (Figure 1, Lane 3) represented the milk fat globule membrane proteins (MFGMP), namely, xanthine oxidase (XDH, 145 kDa) and CD36 (74 kDa). The β-LG band was observed in the protein profile of BMP. The main protein fraction of BMP was casein (24–34 kDa). The protein profile of BMP in this present research was in accordance with the existing literature (Que Phan et al., 2014; Sodini et al., 2006). Pea protein isolates from two different producers exhibited identical protein profiles (Lanes 4–5). The bands having MW between 93 kDa–19 kDa seen in PeP1 and PeP2 were mainly composed of legumin and vicilin fractions. These fractions were lipoxygenase (LOX, 93 kDa), major vicilin (V) fractions (76 kDa and 50 kDa), legumin acidic subunit (Lα, 41 kDa), and legumin basic subunit (Lβ, 25 kDa). The bands having MWs below 35 kDa could be V fractions and disassociated minor V fractions. Similar protein profiles for pea protein were reported in the literature (Shah et al., 2019; Shand et al., 2007). SDS-PAGE analysis of PP1 (Figure 1, lane 6) showed that the predominant protein fraction was patatin (PATT) (39–43 kDa). The bands having MWs above 75 kDa could be patatin aggregates (PATT AGG), which were easily unfolded even at low temperatures (approximately 60°C) as reported in the literature (Schmidt et al., 2018). Formation of monomer, dimer, and trimetric aggregates of patatin with MW of 43, 82, and 108 kDa after heat treatment was reported (Pots et al., 1999). These aggregates could have occurred (1) due to spray drying used during the production and (2) due to the heating step (95°C, 5 min) during SDS-PAGE analysis. The other potato protein (PP2) contained the protein fractions with MW lower than 25 kDa (Figure 1, Lane 7). The bands having MWs of 4.3 kDa-20.6 kDa were identified as protease inhibitors (PI). The weak intensity bands obtained for the SDS-PAGE profiles of the wheat proteins (Figure 1, Lane 8–9–10) and the intensification of the bands below 50 kDa for WP1 and WP3, below 25 kDa for WP2 were consistent with the structure of the wheat proteins showing that they were hydrolyzed enzymatically (Table 1). In a previous study, Wang et al. (2006) fractionated proteolytic hydrolysis of wheat gluten and found similar bands in gel electrophoresis. These bands could be occurred due to the enzymatic hydrolysis of the wheat proteins as reported for hydrolyzed wheat, rice (Yang et al., 2018), and rapeseed proteins (Tessier et al., 2005).
Figure 1. SDS–PAGE profile of proteins from different sources. Lane 1. Standard MW (kDa); Lane 2. WPC; Lane 3. BMP; Lane 4. PeP1; Lane 5. PeP2; Lane 6. PP1; Lane 7. PP2; Lane 8. WP1; Lane 9. WP2; Lane 10. WP3. LF: Lactoferrin, BSA: Bovine serum albumin, β-LG: β-lactoglobulin, α-LA: α-lactalbumin, XDH: Xanthine oxidase, CD36, LOX: Lipoxygenase, V: Vicilin, Lα: Legumin acidic subunit, Lβ: Legumin basic subunit; PATT: Patatin; PATT AGG: Patatin aggregates, PI: Protease inhibitors, WPC: whey protein concentrate, BMP: buttermilk powder.
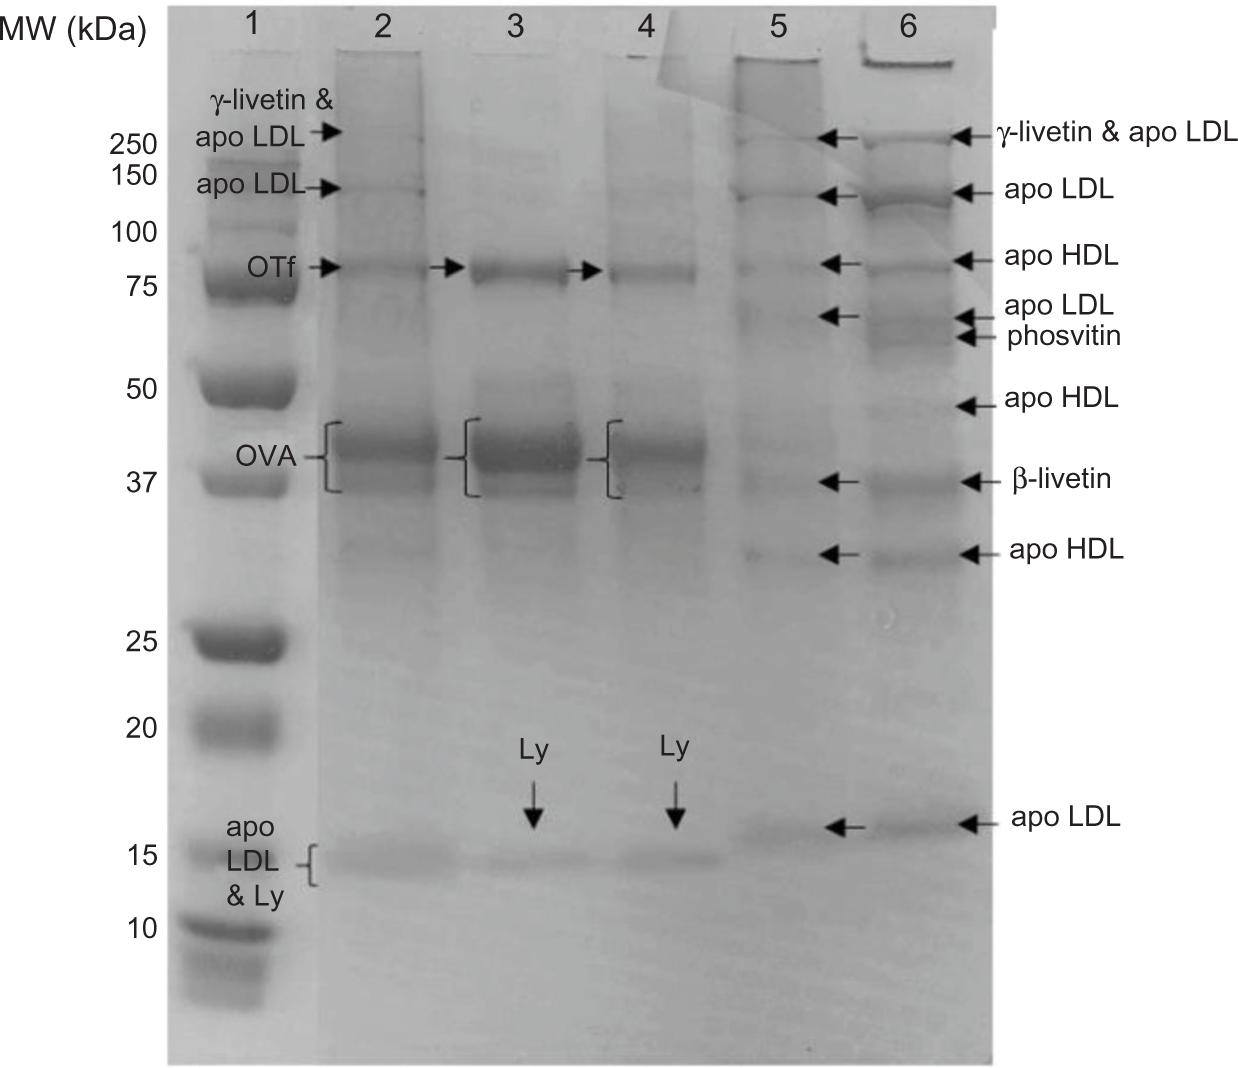
Figure 2. SDS–PAGE gel of egg components. Lane 1. MW standard in kDa; Lane 2. WEP (Whole egg powder); Lane 3. FEW (Fresh egg white); Lane 4. EWP (Egg white powder); Lane 5. EYP (Egg yolk powder); Lane 6. FEY (Fresh egg yolk). OTf: Ovotransferrin, OVA: Ovalbumin, Ly: Lysozyme, apo LDL: Low-density lipoprotein apoprotein, apo HDL: High-density lipoprotein apoprotein.
Figure 2 represents the protein profiles of egg components. WEPLane 2), as a widely used ingredient in the food industry, was included to compare its protein profile with EWP and EYP fractions separately. The protein bands observed for WEP were low-density lipoprotein apoprotein (apo-LDL, 200 kDa), low-density lipoprotein apoprotein (apo-LDL, 116 kDa), ovotransferrin (OTf, 75 kDa), ovalbumin (OVA, 35–40 kDa), high-density lipoprotein apoprotein (apo-HDL, 30 kDa), and lysozyme (Ly, 14 kDa). Ovotransferrin, OVA, and Ly are the egg white proteins, while the others belong to egg yolk (Netting et al., 2015). Similar protein profiles of fresh and powder forms of EW (Figure 2) indicated that spray drying did not influence its protein profile. Egg white protein profiles were in accordance with the literature (Opazo–Navarrete et al., 2018). However, fresh egg yolk (FEY) and EYP exhibited different protein profiles. The protein profile of EYP did not include the two protein bands, while the SDS-PAGE profile of FEY contained 59 kDa, phosvitin, and 47 kDa, apo HDL (Figure 2, Lane 5). The missing bands in the spray-dried EYP protein profile were from the EY granule fraction. The granule fraction accounts for only 19%–25% of the EY based on dry matter (Denmat et al., 2000). As expected, WEP did not contain some of the EYP’s fractions (62 kDa, 59 kDa, 47 kDa, 36 kDa, and 31 kDa) (Lane 2). However, plasma proteins of egg yolk were visible in the protein profile of WEP.
Foaming properties
The foam was defined as a two-phase system that consists of air cells separated by a thin continuous liquid layer named a lamellar phase. Foam systems are relatively unstable. There is a need for stabilizer surfactant molecules to orient at the air/water interface (Makri et al., 2005). During foam formation, protein molecules tend to unfold their hydrophobic side chain in the air and remaining hydrophilic chains in the water phase. The hydrophilic chain portion of protein holds the water in the aqueous phase. Thus, the foam system is prevented from water drainage, coalesces of air bubbles, and obviously, destabilization (Rybak, 2013). Table 3 represents the foaming properties of the samples. As expected, EWP showed the highest FC (174.76%) due to its ovalbumin content, which is a well-known foaming agent (P < 0.05). It was followed by PP2, PP1, WP2, WP1, WP3, WPC, PeP2, PeP1, BMP, and EYP (Table 3). Potato and wheat proteins exhibited the highest FC among the plant proteins. However, pea proteins displayed weak FC. The foaming properties are closely related to the protein’s quickly unfolding structure and its adsorption rate in the interface (Alleoni, 2006).
Table 3. Foaming properties of the samples.
| Protein source | Samples | FC (%) | FS (%) |
|---|---|---|---|
| Wheat | WP1 | 108.47 ± 1.92c | 85.10 ± 2.04b |
| WP2 | 128.84 ± 3.08b | 16.61 ± 2.95e | |
| WP3 | 106.35 ± 2.46c | 26.88 ± 0.61d | |
| Pea | PeP1 | 64.29 ± 2.61e | 85.16 ± 0.60b |
| PeP2 | 81.75 ± 4.68d | 81.50 ± 2.64b | |
| Potato | PP1 | 129.36 ± 3.58b | 96.32 ± 0.10a |
| PP2 | 126.98 ± 2.46b | 7.5 ± 0.15f | |
| Milk | WPC | 89.68 ± 1.94d | 25.68 ± 2.34d |
| BMP | 39.68 ± 2.46f | 0.00 ± 0.00g | |
| Egg | EYP | 19.05 ± 4.26g | 67.22 ± 6.72c |
| EWP | 174.76 ± 17.39a | 91.67 ± 4.44a |
Values were given as mean ± standard deviation (n = 6). (a–g) Different letters in the same column represent significant differences (P < 0.05).
BMP: buttermilk powder, EWP: egg white powder, EYP: egg yolk powder, WPC: whey protein concentrate.
Furthermore, as applied in wheat protein hydrolysates, hydrolytic treatments to native proteins result in reduced MW, facilitated diffusion, and adsorption at the interface (Wouters et al., 2016). The mentioned effects of hydrolytic treatment on the protein profile can be linked to the improved FC of wheat protein hydrolysates (WP1, WP2, and WP3) due to the low MW proteins they contain, as shown in the SDS-PAGE profile (Figure 1). Wheat gluten hydrolysates provided lower MW subunits with higher solubility, and better FC was reported elsewhere (Wang et al., 2006). However, different mechanisms can affect FS, such as the relationship between the decrease in MW and lower FS, and hydrophobic interactions and higher FS (Wouters et al., 2016). The foaming stability of wheat protein hydrolysates, WP2 and WP3, were lower when compared to the proteins with high FS, such as pea proteins, PP1, and EWP. The loss in protein structure by extensive hydrolysis can lead to impaired film formation (Wouters et al., 2016), which is attributed to the obtained lower FS values for wheat protein hydrolysates.
Although pea proteins (PeP1 and PeP2) have similar protein profiles, the FC of PeP2 was significantly higher than that of PeP1 (P < 0.05). However, the FS of pea proteins was not different (P > 0.05). The varying agricultural lines of field pea proteins can explain the significantly different FC results (Shevkani et al., 2015). Barac et al. (2010) reported different foaming capacity and low foam stability independently from pH for six different pea genotypes. The previous study reported that pea protein isolate demonstrated better FC than a broad bean and lupine protein isolates (Makri et al., 2005). In the present study, pea proteins displayed lower FC than other plant-based proteins (Table 3).
The foaming stability is as crucial as FC in a food system. Potato protein isolates displayed high and similar FC, but their FS was different (P < 0.05). Protein profiles were the main difference between potato protein isolates (Figure 1). Higher FS of PP1 could be related to the high MW protein fraction, PATT. A similar relationship between the high stability of foams and the globular proteins with high MW was reported elsewhere (Pęksa et al., 2008). The criteria for better foaming were reported as (1) rapid adsorption at the air/water interface during bubbling, (2) ability for a conformational change, rearrangement at the interface, and (3) ability to form a cohesive viscoelastic film via intermolecular interactions (Makri et al., 2005).
Furthermore, a higher charge on the proteins has a weakening effect on the hydrophobic reaction, which leads to increased solubility and flexibility. Proteins with higher solubility and flexibility can move quickly to the air-water interface (Shevkani et al., 2015) and support improved foaming. Therefore, better foaming abilities obtained for PP1 may be related to those attributes mentioned above.
The foaming capacity of WPC (89.68%) was significantly higher than the FC of BMP (39.68%) (P < 0.05). However, both milk proteins did not form stable foams. A previous study reported comparable FC of both spray-dried WPC obtained from acid and sweet whey with the FC of EW (Slack et al., 1986). The well-described factors that affect foaming properties are the existence of lipids, ash, protease peptone, degree of denaturation (El-Shibiny et al., 2007), denaturation of β-LG, the origin of α-LA (sweet or acid whey), and drying methods of WPC (spray drying or freeze-drying) (Slack et al., 1986). In our study, the fat content of BMP could be the reason for unstable foam formed by BMP. A study that reported similar results linked lower FC of BMP to the competition between the fat and protein in buttermilk at the interface (Sodini et al., 2006).
Particularly, foam-forming proteins can create a firm film around the air bubble by lowering the interfacial tension between air and liquid phases, which leads to an increase in viscosity and elasticity of the liquid phase (Pęksa et al., 2008). As we detected in this study, the foam volume obtained with protein isolates tends to decrease as a function of time (Butt and Batool, 2010). The lower FC values can be due to inadequate electrostatic repulsions, lesser solubility, and excessive protein-protein interactions.
Emulsion properties
The stability of an emulsion is related to its resistance to creaming. The emulsion stability is crucial, especially during the shelflife of emulsified food products such as mayonnaise, ready-to-bake cake batter, and sauces. Table 4 represents the EA, ES, and EHS (%) of samples. There was no difference between the EA of EYP and PeP1 (P > 0.05). Also, the ES of EYP and PeP1 was similar. These results showed that PeP1 could be a replacer for the EA of EYP effectively at the same concentration and conditions. In contrast to our findings, Barac et al. (2010) reported low emulsion activity index for commercial pea protein isolate at pH 7.0 and pH 8.0 compared to in-house isolated proteins. The researchers followed the spectrophotometric method for emulsion functions with lower protein concentration (1 g/kg) and different protein solution: oil ratio (1:3) than our study. The procedure, sample concentration, equipment used, and homogenization duration can be the reason for diverse results.
Table 4. Emulsifying properties of the protein sources.
| Protein source | Proteins | EA (%) | ES (%) | EHS (%) 80°C–30 min | |
|---|---|---|---|---|---|
| 1 h | 24 h | ||||
| Wheat | WP1 | 11.60 ± 0.99d | 79.33 ± 2.80c,d | 50.50 ± 1.22e | 3.93 ± 0.03g |
| WP2 | 40.87 ± 1.77c | 68.50 ± 2.00e | 57.00 ± 3.52b,c,d,e | 7.45 ± 0.65f | |
| WP3 | 44.08 ± 0.75b | 78.73 ± 2.98c,d | 51.70 ± 3.39c.d,e | 7.19 ± 0.73f | |
| Pea | PeP1 | 47.15 ± 0.80a | 92.67 ± 1.63a | 57.75 ± 2.04b,c | 44.08 ± 0.74a,b |
| PeP2 | 43.48 ± 0.59b | 74.33 ± 2.34d,e | 50.83 ± 5.95d,e | 40.71 ± 1.19c | |
| Potato | PP1 | 44.17 ± 0.55b | 73.50 ± 4.85d,e | 55.33 ± 6.41b,c,d,e | 45.30 ± 1.35a |
| PP2 | 41.24 ± 0.62c | 78.67 ± 1.97c,d | 56.33 ± 1.63b,c,d,e | 35.26 ± 1.21d | |
| Milk | WPC | 44.03 ± 1.42b | 84.17 ± 4.92b,c | 58.58 ± 1.24b | 43.05 ± 1.76b |
| BMP | 43.57 ± 1.15b | 82.67 ± 4.32c | 54.70 ± 2.19b,c,d | 42.27 ± 1.15b,c | |
| Egg | EYP | 49.11 ± 1.18a | 90.00 ± 1.41a,b | 68.08 ± 3.26a | 14.03 ± 0.90e |
Values were given as mean ± standard deviation (n = 6). (a–f) Different letters in the same column represent significant differences (P < 0.05).
BMP: buttermilk powder, EYP: egg yolk powder, WPC: whey protein concentrate.
Among the protein sources, the wheat protein (WP1) displayed the lowest EA (P < 0.05). Animal protein sources, WPC and BMP, showed relatively high EA, and their ES values after 1 h were higher when compared to wheat protein WP2, pea protein PeP2, and potato protein PP1. The emulsion stability of all proteins decreased after 24 h. The composition and processing conditions of emulsions affect the emulsion stability (Hu et al., 2017). EYP formed the most stable emulsions EYP (68.08%, ES), and WPC (58.58%), PeP1 (57.75%), and BMP (57.50%) followed it, respectively. Among the protein sources, ES of WP1 was the lowest (P < 0.05). However, the ES of wheat proteins at the end of 24 h was not statistically different from each other (P > 0.05). Therefore, wheat proteins cannot be an alternative for mimicking EA and ES of egg proteins.
Various heat treatments are applied during food production. Therefore, the effect of heat treatment on emulsifying properties was also in our interest. Researchers reported the impairing effect of heat treatment on proteins’ emulsifying characteristics due to irreversible protein denaturation (Dissanayake & Vasiljevic, 2009). However, the partial unfolding of protein may increase proteins’ surface hydrophobicity, leading to enhanced potential protein adsorption at the interface with improved emulsifying properties (Dissanayake & Vasiljevic, 2009; Li et al., 2011; Peng et al., 2016). Our findings indicate that the most heat-resistant emulsions were obtained from PP1 and PeP1 (Table 4). Besides, emulsions prepared with WPC and BMP resisted the heat treatment. The decrease in EA (%) after heat treatment was 2.23% and 2.98% for WPC and BMP, respectively. Moreover, whey protein is the frequently used component in food formulations to stabilize foams or emulsions via forming films and producing stable gels (Konrad et al., 2005). The improved emulsion stability of heat-treated whey protein was linked to the generation of stable nanoparticles and/or aggregates, which can stabilize the emulsion by increasing the continuous phase’s viscosity and participating in layer formation on the oil droplets (Dybowska, 2011). Surface hydrophobicity influences the emulsion properties of protein and peptides, and β-LG exhibited higher surface hydrophobicity than α-LA, indicating that β-LG is the main contributor to whey protein’s functional properties (Schröder et al., 2017). However, a previous study showed that the emulsion stabilities of whey protein (spray dried) and its major fraction β-LG’s (freeze dried) were different. For example, spray drying can lead to partial denaturation in WPC proteins and the formation of strong intramolecular bonds. It was found that WPC mimics composed of freeze-dried proteins (57% β-LG, %37 α-LA, %6 BSA) exhibited similar emulsion properties as freeze-dried β-LG (Tcholakova et al., 2006). Therefore, it is evident that the protein fraction and the production method influence the functional properties. Corredig and Dalgleish (1998) reported that among the protein fractions, the adsorbed casein ratio was 50% at the interface of the oil in water emulsion prepared with BMP. In addition, caseins and whey proteins covered the fat globule surface area, but caseins reduced the surface tension faster than whey proteins (Cano-Ruiz and Richter, 1997). Therefore, the good emulsifying activity obtained from this study can be linked to the casein fraction of BMP.
Similar to EA and ES values, the decrease in heat resistance of wheat proteins’ emulsions were 66%, 81.77%, and 83.69% for WP1, WP2, and WP3, respectively (Table 4). Wang et al. (2006) reported a decrease in solubility with the increase in temperature above 50°C for the wheat protein hydrolysate fractions. The heat treatment applied in this study (80°C, 30 min) can explain the reason for lower EHS values for wheat protein hydrolysates. The heat resistance of the emulsion prepared with EYP was low as the results were obtained from wheat protein emulsions. The low EHS of the emulsion of EYP may be due to the heat-induced denaturation of apo-LDL and lipovitellins (above 65°C), egg yolk proteins, and the tendency of denatured EYP to form gel network as reported in the literature (Campell et al., 2005). Besides, heat treatment might cause the disruption of the adsorbed hydrolyzed wheat protein and EYP at the interface. The plasma proteins of the egg yolk are the major contributors to the emulsion formation, especially a lipoprotein apo-LDL (17 kDa) (Denmat et al., 2000). In our study, the protein bands mentioned above were available for the EY protein profile (Figure 2). In contrast, a slight increase was detected for EHS of the emulsion of PP1 attributable to the improved interfacial properties due to enhanced protein-oil reaction by heat-induced changes and exposure to hydrophobic groups (Chao and Aluko, 2018). Similar to our results, the positive effect of heat treatment (80°C, 30 min) on the patatin fraction’s emulsion resistance was linked to the formation of aggregates or gels and enhancement of the interfacial layer resistance (Ralet and Guéguen, 2000).
Although protein profiles of PeP1 and PeP2 were identical, their foaming and emulsifying activities were different. The production process applied different surface hydrophobicity, solubility, and ability to adhere to the air–water and water–oil interfaces and their agricultural varieties (Dissanayake & Vasiljevic, 2009; Shevkani et al., 2015; Li et al., 2011; Peng et al., 2016) can explain the difference. Among the legume proteins, the pure vicilin fraction exhibited better functional properties than the pure legumin fraction due to different protein structures of 7 S and 11 S proteins (Barać et al., 2015). Therefore, the pea genotypes with a higher vicilin/legumin ratio can be more suitable for their functional properties. In contrast, Barac et al. (2010) reported that the pea genotype with the lowest vicilin/legumin ratio showed the highest emulsion stability. The authors explained this with higher adsorption of legumin at the interface due to its higher surface hydrophobicity than vicilin. Therefore, legumin fraction may be responsible for the higher EA values obtained for PeP1. In addition, the compact structure of the legumin fraction can resist thermal-unfolding, thus forming heat-stable emulsions as obtained for PeP1 and PeP2 (Ladjal-Ettoumi et al., 2016). A previous study reported that emulsifying capability of the pea protein isolate was significantly higher than the soy protein isolate at varying concentrations (10–15 mg/mL) at pH 5.0 and 7.0 (Aluko et al., 2009). Our results also indicated that PeP1 is a good plant-based candidate for replacing the emulsifying properties of EYP (P > 0.05). Furthermore, the EA of PeP1 was not influenced by the heat treatment (Table 4), made it an alternative to replace EYP.
Emulsion morphology
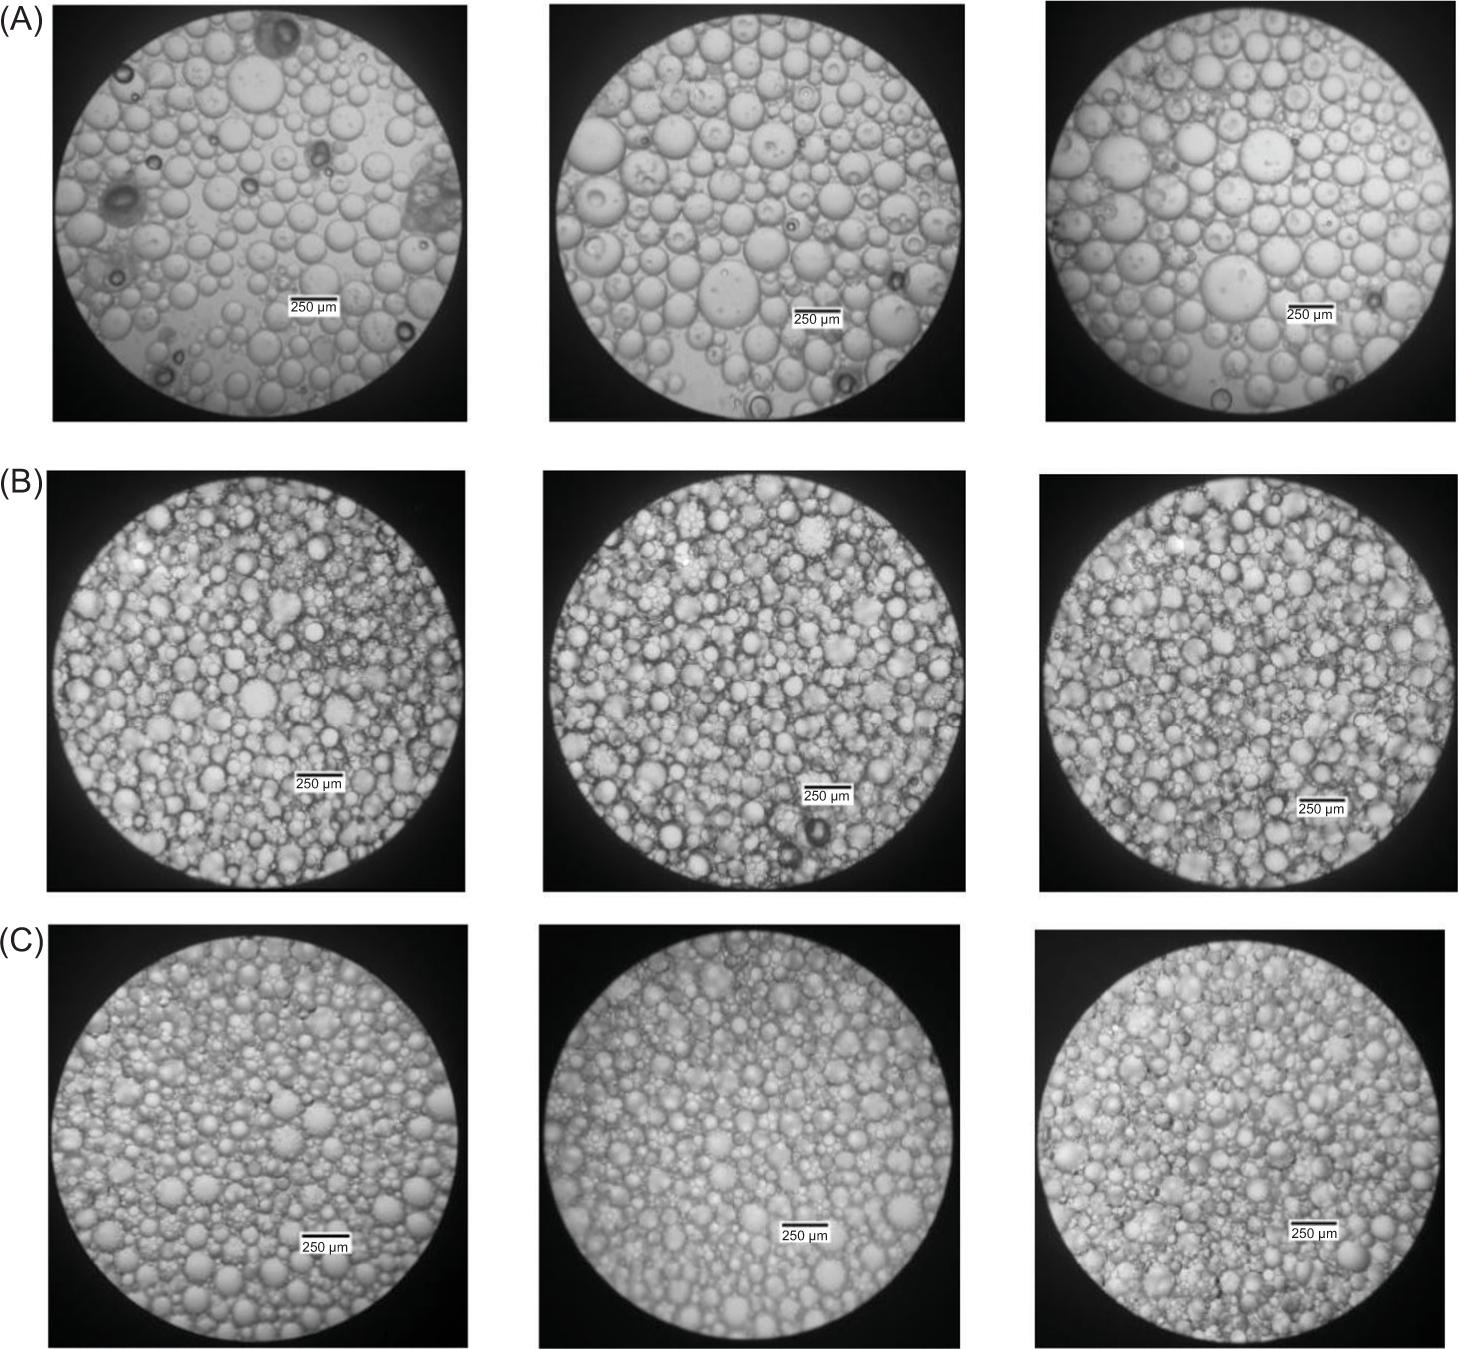
Figure 3 indicates that samples’ emulsion morphology exhibited better emulsifying properties (EYP, PeP1, WPC). In general, EYP formed independent and larger emulsion droplets with an average diameter of 170.04 µm, while the emulsion droplets formed by WPC and PeP1 were closely distributed, intense, intact, and smaller in size. Table 5 lists the average droplet diameters of the emulsions. The average diameters of the droplet size of the emulsions of WPC and PeP1 were 56.11 and 44.15 µm, respectively. These values were approximately 3 to 4 times lower than the droplet size of the EYP emulsion (P < 0.05). Homogenously distributed, relatively small-sized emulsion droplets represent the nonflocculated situation positively affecting the ES. The resistance to creaming is related to factors such as smaller droplet size, the lower difference between the densities of continuous and dispersed phases, and the higher viscosity of the continuous phase (Hu et al., 2017).
Figure 3. Digital photographs of emulsions under light microscope (10×) (A) EYP (B) PeP1 (C) WPC.
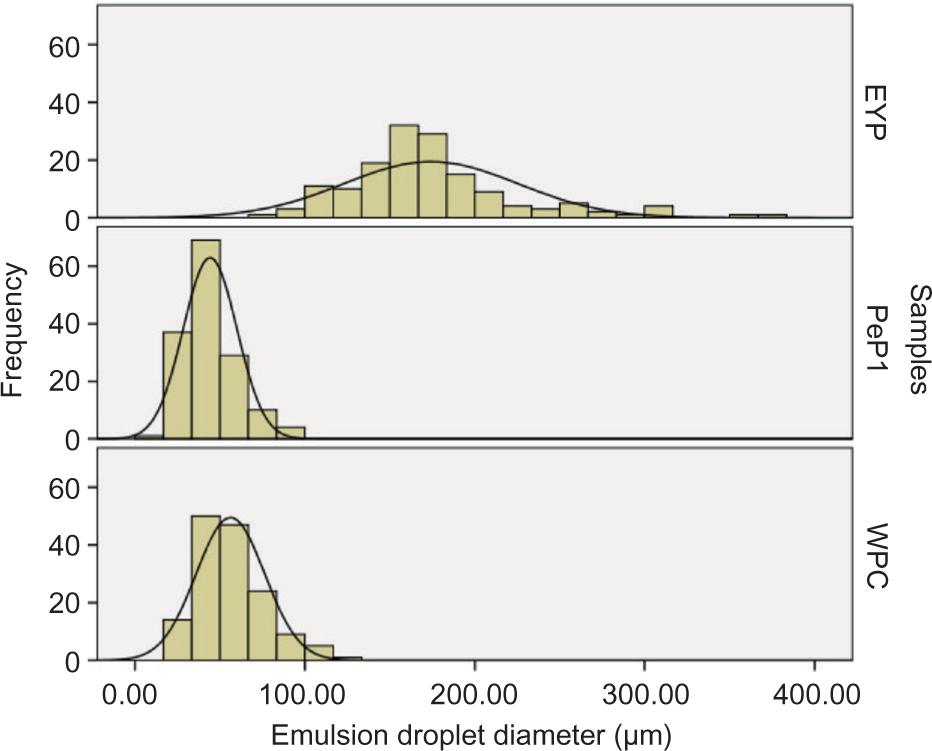
The emulsion droplet size distribution of EYP was in a wide range (Figure 4). However, the droplet size distribution of the emulsions of PeP1 and WPC was apparently in a narrow range. In close agreement with the size distribution results, the emulsions of WPC and PeP1 were relatively resistant to creaming than the emulsion of EYP. Although the emulsion droplet average diameter of EYP was large and their distribution was in a wide range, the high emulsion stability of EYP (Table 4) can be explained by the different conditions (sample concentration, duration of homogenization, energy input, and water:oil ratio) applied during emulsion formation in ES analysis and the morphology evaluation. The continuous phase’s viscosity supports ES by limiting the emulsion droplets’ mobility, leading to the prevention of creaming or coalescence (Motta-Romero et al., 2017). Besides, forming smaller oil droplets in a continuous aqueous phase, which has sufficiently high viscosity to prevent oil droplets from coalescence, is crucial in increasing ES (Rybak, 2013).
Figure 4. The distribution of the emulsion droplet size for EYP, PeP1, and WPC.
Table 5. Average emulsion droplet diameter (µm).
| Morphology evaluation | EYP (a) | PeP1 (b) | WPC (c) |
|---|---|---|---|
| 1. | 153.36 ± 39.88b,A | 43.91 ± 14.89a,C | 65.62 ± 19.92a,B |
| 2. | 184.18 ± 55.98a, A | 45.56 ± 16.46a,B | 48.47 ± 14.83b,B |
| 3. | 184.59 ± 51.38a,A | 42.99 ± 16.31a,B | 54.25 ± 21.46b,B |
| Average | 174.04 ± 51.35A | 44.15 ± 15.83C | 56.12 ± 20.14B |
Values were given as mean ± standard deviation (n = 150). 1, 2, 3 represent the number of repeats. (a–c) Different letters in the same column represent significant differences (P < 0.05). (A–C) Different letters in the same line represent significant differences (P < 0.05).
EYP: egg yolk powder, WPC: whey protein concentrate.
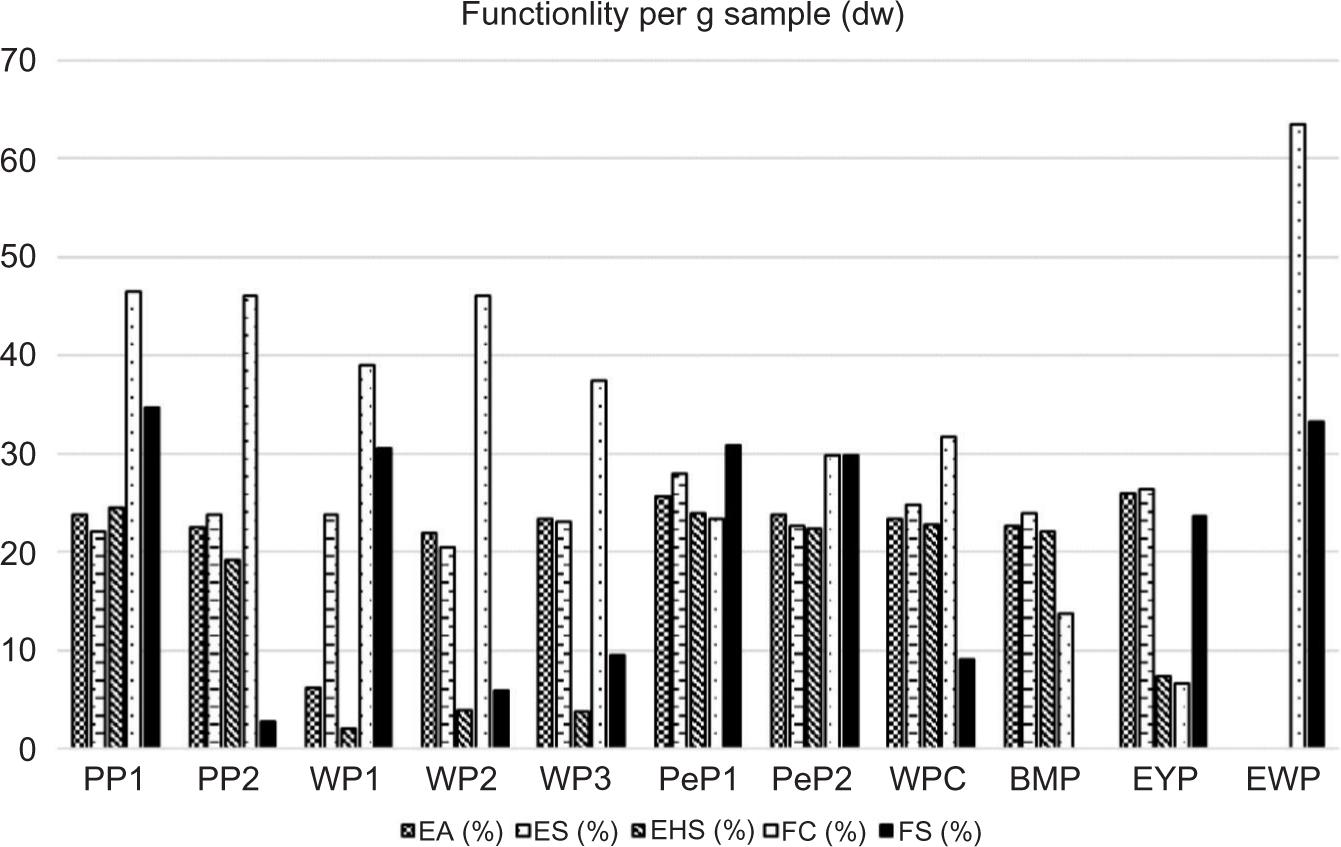
Functionality per dry weight
We evaluated the results as functionality (%) per gram of dry weight (dw) of the sample rather than protein amount because of the possible contribution of nonprotein components (phospholipids), namely, BMP, WPC, and EYP to the functional properties (Figure 5). Results showed that PP1, PeP1, PeP2, WPC, and BMP could replace egg fractions’ various functions. Depending on the importance of the required function for a specific food product (mayonnaise, cake batter, sauces), the proteins mentioned above may be utilized alone or in combination. Although BMP has relatively lower protein content, functionality (%) per dw was better in all aspects, except for the FS. BMP provided 87% of EA formed by EYP alone (Figure 5). Therefore, further isolation and purification of BMP fractions and phospholipids can have great potential for techno-functionality in the food industry. For instance, the good emulsifying capacity of MFGMP found in BMP was reported previously (Abdul Hussain and Al-Oulabi, 2009). Our results based on the functionality (%)/g dw showed that BMP and WPC could replace EY’s emulsifying function. Pea proteins (PeP1 and PeP2) supplied good functionalities for all functions when evaluated based on dw. However, PeP1 had more significant potential in emulsion formation and stability than PeP2. Therefore, PeP1 may be an option for egg replacement studies.
Figure 5. Functionality per gram sample (dw).
Regarding potato proteins’ functionality, the FC determined for PP1 was higher than PP2, most probably due to the PATT and PATT AGG fractions. Moreover, lower FS obtained for the PI fraction (PP2) brought the PATT fraction (PP1) to the fore to be used as an allergen-free alternative to the foaming properties of EWP. Similar to our findings, higher foam overrun was determined for PATT fraction at pH 3.0 and pH 5.0 than PI (Schmidt et al., 2018). However, similar FS for PATT and PI fractions were reported in the same study. Contrary results should be explained with the diversity of the methods and samples’ purity. All wheat proteins exhibited high foaming capacities, but the EHS values were the lowest. Therefore, WP1 may be an alternative for the food formulations requiring high volume and stable foam instead of EW. Similar to our findings, Wang et al. (2006) reported higher FC for enzymatically hydrolyzed wheat proteins due to increased surface activity by the polypeptides produced. These results showed that combining different protein sources might be a good strategy to replace eggs’ functions in different food matrices.
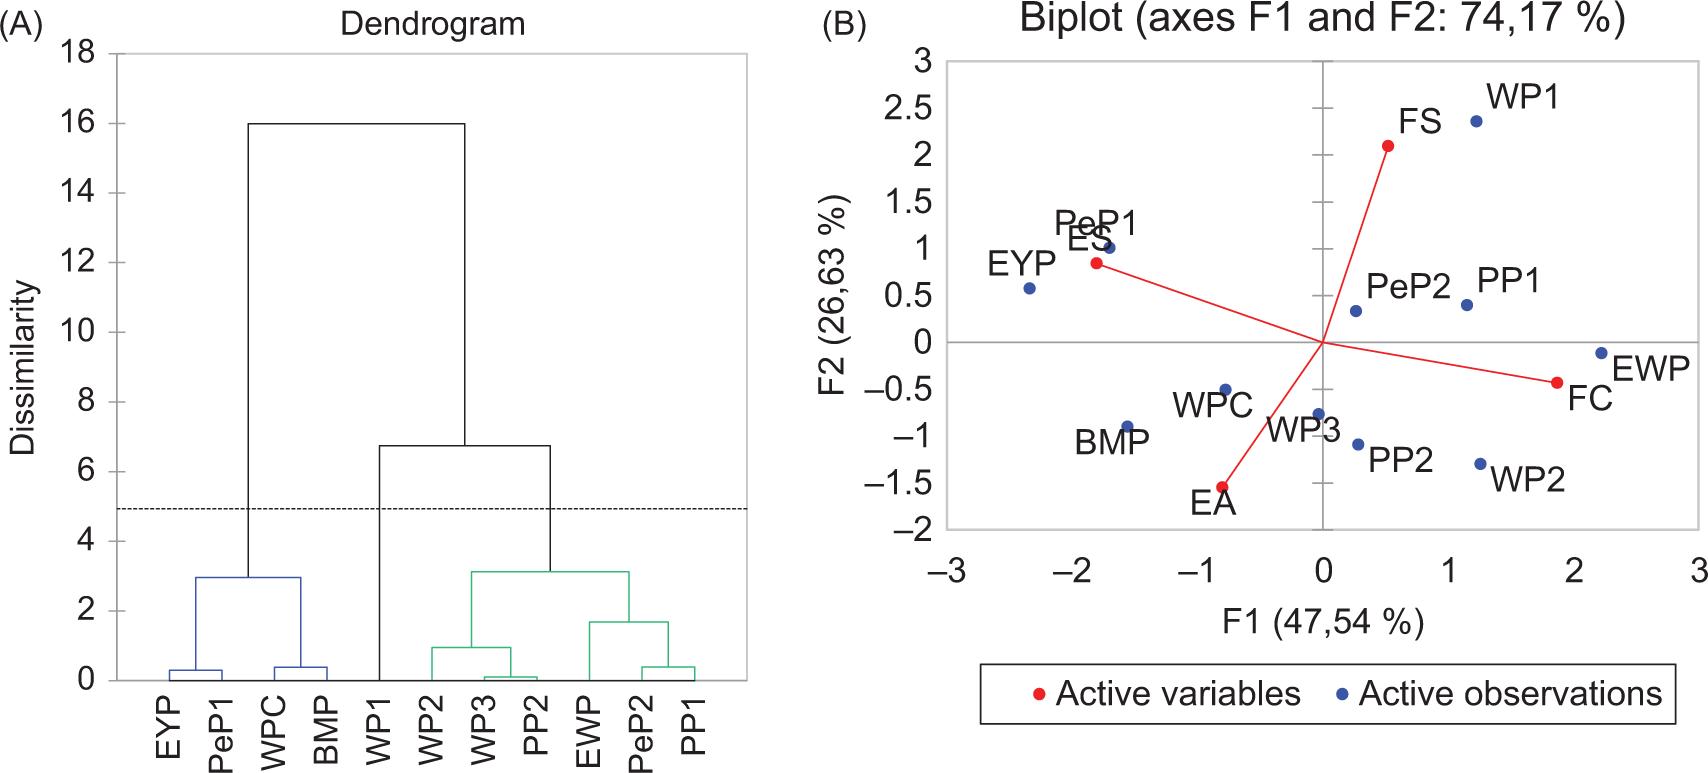
Cluster and Principal Component Analysis
Cluster Analysis and PCA show the differences among samples and the relationship between variables in functional properties (EA, ES, FC, and FS). Factor analysis showed that four principal components explained the total variation. There were very strong correlations between ES and F1 component (−0.899) and FC and F1 component (0.931). In FS, a strong relationship was found for the F2 component (0.780). A moderate relationship between EA and F2 component was also detected (−0.576). These two components explained 74.17% of the total variance. Therefore, F1 and F2 were used for PCA, and a biplot diagram was obtained. Figure 6 shows the cluster and biplot diagrams of PCA analysis. Three main clusters explained the variability and similarity among the samples’ functional properties. One of them included EYP and PeP1, and the other was composed of WPC and BMP in line with the results we found for emulsion functions. Wheat protein, WP1, formed the second cluster alone. The third cluster involved EWP, PeP2, PP1, PP2, WP2, and WP3. Besides, PP1 with better foaming functions formed a segment with EWP in the third cluster. F1 is linked to ES and FC, while F2 is linked to EA and FS. Also, following the functional properties (%), there was a close correlation between PeP1 and EYP for ES. Also, the EA of BMP and WPC were closer. In the case of foaming properties, PP1 displayed the closest similarity with EWP.
Figure 6. Cluster diagram (A) and PCA Biplot diagram (B).
Conclusion
This study examined the different proteins from animal and plant sources for their foaming and emulsifying properties separately and their protein profiles. All samples’ protein profiles agreed with the existing literature, indicating the commercial samples’ original characteristics. Although spray drying caused EY’s protein profile changes, it did not influence EW’s protein profile. Two different branded pea protein isolates demonstrated different functional properties, although their protein profiles were identical.
Among the samples, EWP showed the highest FC and FS as expected. Our results showed that plant proteins used in this study revealed higher foaming properties than animal proteins. The foaming capacity of potato protein isolates arose from the protein fractions PATT and PI they contain, and the stability of foam arises from the PATT fraction. Our results demonstrated the great potential of PP1 providing the foaming function of EWP due to its higher FC and FS. Therefore, PP1 should be considered a good candidate and as a nonallergenic and vegan option for foaming properties to replace EWP.
The emulsifying properties of samples revealed the PeP1 as the best EYP alternative (P < 0.05). However, WPC and BMP also displayed suitable emulsion activities. The stabilities of all emulsions decreased within time at room temperature. However, EYP exhibited the highest ES after 24 h. The average emulsion droplet size of PeP1 was the smallest among the samples, and WPC and EYP followed it (P < 0.05).
The egg is the key ingredient responsible for foaming and emulsifying properties in various food applications such as cake batter preparation. Providing similar functional and sensory properties with alternative plant and animal-based proteins should bring about a new perspective to product development studies. Furthermore, obtained successful results should be confirmed by sensory evaluation. This research can be further supported in complex food matrices where interactions between sugar, flour, proteins, and fats occur.
In conclusion, PP1 has a high potential to replace EWP’s foaming function, whereas PeP1, WPC, and BMP should be considered as alternatives to EYP’s emulsifying function. In addition, PP1 and PeP1 should be highlighted as allergen-free, vegan alternatives for the functions mentioned above. Furthermore, samples evaluated in this study should be used alone or in combination to provide functional properties required for certain food products.
Acknowledgements
Karakaya and Köstekli thank Dr. Oetker Gıda Sanayi Tic. A.Ş. for providing materials. This article includes data from some parts of the Ph.D. thesis conducted by Mine Köstekli Büyükcan.
Funding
This research did not receive any specific grant from funding agencies in public, commercial, or not-for-profit sectors.
Conflict of Interest
The authors declare that they have no conflict of interest. Büyükcan holds the Research and Development Manager position at Dr Oetker Gıda Sanayi Tic. A.Ş., İzmir, Turkey.
Availability of data and material (data transparency): Available
Authors’ Contributions
Mine Köstekli Büyükcan and Sibel Karakaya were involved with conceptualization and methodology; Mine Köstekli Büyükcan was concerned with investigation, formal analysis, resources, writing original draft, reviewing, and editing; Sibel Karakaya did the writing, reviewing, editing, and supervision. All authors have read and agreed to the submitted version of the manuscript.
REFERENCES
Abd El-Salam, M.H., El-Shibiny, S. and Aida, S., 2009. Factors affecting the functional properties of whey protein products: a review. Food Reviews International 25(3): 251–270. 10.1080/87559120902956224
Abdul Hussain, S.S. and Al-Oulabi, R.A., 2009. Studying the possibility of preparing an egg-free or eggless cake. International Journal of Engineering and Technology 1(4): 324–329. 10.7763/IJET.2009.V1.65
Alleoni, A.C.C., 2006. Albumen protein and functional properties of gelation and foaming. Scientia Agricola 63(3): 291–298. 10.1590/S0103-90162006000300013
Aluko, R.E., Mofolasayo, O.A., Watts, B. M., 2009. Emulsifying and foaming properties of commercial yellow pea (Pisum sativum L.) seed flours. Journal of Agricultural and Food Chemistry 57(20): 9793–9800. 10.1021/jf902199x
Barac, M., Cabrilo, S., Pesic, M., Stanojevic, S., Zilic, S., Macej, O. and Ristic, N., 2010. Profile and functional properties of seed proteins from six pea (Pisum sativum) genotypes. International Journal of Molecular Sciences 11: 4973–4990. 10.3390/ijms11124973
Barać, M.B., Pešić, M.B., Stanojević, S.P., Kostić, A. and Čabrilo, S.B., 2015. Techno-functional properties of pea (Pisum sativum) protein isolates–a review. Acta Perodica Technologica 46: 1–18. 10.2298/APT1546001B
Butt, M.S. and Batool, R., 2010. Nutritional and functional properties of some promising legume protein isolates. Pakistan Journal of Nutrition 9(4): 373–379. 10.3923/pjn.2010.373.379
Campell, L., Raikos, V. and Euston, S.R., 2005. Heat stability and emulsifying ability of whole egg and egg yolk as related to heat treatment. Food Hydrocolloids 19(3): 533–539. 10.1016/j.foodhyd.2004.10.031
Cano-Ruiz, M.E. and Richter, R.L., 1997. Effect of homogenization pressure on the milk fat globule membrane proteins. Journal of Dairy Science 80: 2732–2739. 10.3168/jds.S0022-0302(97)76235-0
Chandi, G.K. and Sogi, D.S., 2006. Functional properties of rice bran protein concentrate. Journal of Food Engineering 79(2): 592–597. 10.1016/j.jfoodeng.2006.02.018
Chao, D. and Aluko, R.E., 2018. Modification of the structural, emulsifying, and foaming properties of an isolated pea protein by thermal pretreatment. CyTA—Journal of Food 16(1): 357–366. 10.1080/19476337.2017.1406536
Corredig, M. and Dalgleish, D.G., 1998. Buttermilk properties in emulsion with soybean oil as affected by fat globule membrane derived proteins. Journal of Food Science 6(3): 476–480. 10.1111/j.1365-2621.1998.tb15767.x
Denmat, M.L., Anton, M. and Beumal, V., 2000. Characterization of emulsion properties and of interface composition in O/W emulsions prepared with hen egg yolk, plasma and granules. Food Hydrocolloids. 14: 539–549. 10.1016/s0268-005x(00)00034-5
Dissanayake, M. and Vasiljevic, T., 2009. Functional properties of whey proteins affected by heat treatment and hydrodynamic high-pressure shearing. Journal of Dairy Science 92(4): 1387–1397. 10.3168/jds.2008-179
Dybowska, B.E., 2011. Whey protein-stabilized emulsion properties in relation to thermal modification of the continuous phase. Journal of Food Engineering 104: 81–88. 10.1016/j.jfoodeng.2010.11.030
El-Shibiny, S., Farrag, A.F., El-Garawany, G. and Assem, F.M., 2007. Rheological and functional properties of whey protein concentrate and β-lactoglobulin and α-lactalbumin rich fractions. International Journal of Dairy Science 2(3): 196–206. 10.3923/ijds.2007.196.206
Geera, B., Reiling, J.A., Hutchison, M.A., Rybak, D., Santha, B. and Ratnayake, W.S., 2011. A comprehensive evaluation of egg and egg replacers on the product quality of muffins. Journal of Food Quality 34: 333–342. 10.1111/j.1745-4557.2011.00400.x
Hu, Y.T., Ting, Y., Hu, J.Y. and Hsieh, S.C.J., 2017. Techniques and methods to study functional characteristics of emulsion systems. Journal of Food and Drug Analysis 25(1): 16–26. 10.1016/j.jfda.2016.10.021
Ivanova, P., Chalova, V. and Koleva, L., 2014. Functional properties of proteins isolated from industrially produced sunflower meal. International Journal of Food Studies 3: 203–212. 10.7455/ijfs/3.2.2014.a6
Jarpa-Parra, M., 2018. Lentil protein: a review of functional properties and food application. An overview of lentil protein functionality. International Journal of Food Science and Technology 53: 892–903. 10.1111/ijfs.13685
Jiménez, X.T., Cuenca, A.A., Jurado, A.T., Corona, A.A. and Urista, C.R.M., 2012. Traditional methods for whey protein isolation and concentration: effects on nutritional properties and biological activity. Journal of the Mexican Chemical Society 56(4): 369–377. 10.29356/jmcs.v56i4.246
Kawano, S., Kida, T., Akashi, M., Sato, H., Shizuma, M. and Ono, D., 2015. Preparation of pickering emulsions through interfacial adsorption by soft cyclodextrin nanogels. Beilstein Journal of Organic Chemistry 11: 2355–2364. 10.3762/Fbjoc.11.257
Kohrs, D., Herald, T.J., Aramouni, F.M. and Abughoush, M., 2010. Evaluation of egg replacers in a yellow cake system. Emirates Journal of Food and Agriculture 22(5): 340–352. 10.9755/ejfa.v22i5.4822
Konrad, G., Kleinschmidt, T., Rohenkohl, H. and Reimerdes, E.H., 2005. Peptic partial hydrolysis of whey protein concentrates for modifying the surface properties of whey protein. II. Effects on the emulsifying and foaming properties. Milchwissenschaft 60(2): 195–198.
Ladjal-Ettoumi, Y., Boudries, H. and Chibane, M., 2016. Pea, chickpea and lentil protein isolates: physicochemical characterization and emulsifying properties. Food Biophysics 11: 43–51. 10.1007/s11483-015-9411-6
Laemmli, U.K., 1970. Cleavage of structural proteins during the assembly of the head of bacteriophage T4. Nature 227: 680–685. 10.1038/227680a0
Li, F., Kong, X., Zhang, C. and Hua, Y., 2011. Effect of heat treatment on the properties of soy protein-stabilized emulsions. International Journal of Food Science & Technology 46(8): 1554–1560. 10.1111/j.1365-2621.2011.02647.x
Lin, M., Tay, S.H., Yang, H., Yang, B. and Li, H., 2017. Replacement of eggs with soybean protein isolates and polysaccharides to prepare yellow cakes suitable for vegetarians. Food Chemistry 229: 663–673. 10.1016/j.foodchem.2017.02.132
Makri, E., Papalamprou, E. and Doxastakis, G., 2005. Study of functional properties of seed storage proteins from indigenous European legume crops (lupin, peas, broad bean) in a mixture with polysaccharides. Food Hydrocolloids 19(3): 583–594. 10.1016/j.foodhyd.2004.10.028
Motta-Romero, H., Zhang, Z., Nguyen, A.T., Schlegel, V. and Zhang, Y., 2017. Isolation of egg yolk granules as low-cholesterol emulsifying agent in mayonnaise. Journal of Food Science 82(7): 1588–1593. 10.1111/1750-3841.13747
Netting, M., Donato, A., Makrides, M., Gold, M., Quinn, P. and Penttila, I., 2015. Allergenicity of pasteurized whole raw Hen’s egg compared with fresh whole raw Hen’s egg. Pediatric Allergy and Immunology 26(3): 234–238. 10.1111/pai.12365
Ogunwolu, S.O., Henshaw, F.O., Mock, H.P., Santros, A. and Awonorin, S.O., 2009. Functional properties of protein concentrates and isolates produced from cashew (Anacardium occidentale L.) nut. Food Chemistry 115(3): 852–858. 10.1016/j.foodchem.2009.01.011
Opazo–Navarrete, M., Altenburg, M.D., Boom, R.M. and Janssen, A.E.M., 2018. The effect of gel microstructure on simulated gastric digestion of protein gels. Food Biophysics 13: 124–138. 10.1007/s11483-018-9518-7
Pęksa, A., Rytel, E., Kita, A., Lisińska, G. and Tajner-Czopk, A., 2008. The properties of potato protein. In N. Yee and W.T. Bussell (eds.), Food III (Special Issue 1), pp. 79–87. Global Science Books, Ikenobe, Kagawa.
Peng, W., Kong, X., Chen, Y., Zhang, C., Yang, Y. and Hua, Y., 2016. Effects of heat treatment on the emulsifying properties of pea proteins. Food Hydrocolloids 52: 301–310. 10.1016/j.foodhyd.2015.06.025
Pots, A.M., Grotenhuis, E.T., Gruppen, H., Voragen, A.G.J. and de Kruif, K.G., 1999. Thermal aggregation of patatin studied in situ. Journal of Agricultural and Food Chemistry 47: 4600–4605. 10.1021/jf9901901
Que Phan, T.T., Moens, L., Le, T.T., Van der Maaren, P. and Dewettinck, K., 2014. Potential of milk fat globule membrane enriched materials to improve the whipping properties of recombined cream. International Dairy Journal 39(1): 16–23. 10.3168/jds.2014-8030
Ralet, M.C. and Guéguen, J., 2000. Fractionation of potato proteins: Solubility, thermal coagulation and emulsifying properties. Lebensmittel-Wissenschaft und-Technologie 33: 380–387. 10.1006/fstl.2000.0672
Rybak, O., 2013. Some aspects of the formation of emulsions and foams in food industry. Ukrainian Journal of Food Science 1: 41–49.
Schmidt, J.M., Damgaard, H., Greve-Poulsen, M., Larsen, L.B. and Hammershøj, M., 2018. Foam and emulsion properties of potato protein isolate and purified fractions. Food Hydrocolloids 74: 367–378. 10.1016/j.foodhyd.2017.07.032
Shah, N.N., Umesh, K.V. and Singhal, R.S., 2019. Hydrophobically modified pea proteins: synthesis, characterization and evaluation as emulsifiers in eggless cake. Journal of Food Engineering 255: 15–23. 10.1016/j.jfoodeng.2019.03.005
Shand, P.J., Ya, H., Pietrasik, Z. and Wanasundara, P.K.J.P.D., 2007. Physicochemical and textural properties of heat-induced pea protein isolate gels. Food Chemistry 102(4): 1119–1130. 10.1016/j.foodchem.2006.06.060
Shen, L. and Tang, C.H., 2012. Microfluidization as a potential technique to modify surface properties of soy protein isolate. Food Research International 48: 108–118. 10.1016/j.foodres.2012.03.006
Shevkani, K., Singh, N., Kaur, A. and Rana, J.C., 2015. Structural and functional characterization of kidney bean and field pea protein isolates: a comparative study. Food Hydrocolloids 43: 679–689. 10.1016/Fj.foodhyd.2014.07.024
Schröder, A., Berton-Carabin, C., Venema, P. and Cornacchia, L., 2017. Interfacial properties of whey protein and whey protein hydrolysates and their influence on O/W emulsion stability. Food Hydrocolloids 73: 129–140. 10.1016/j.foodhyd.2017.06.001
Slack, A.W., Amundson, C.H. and Hill, C.G., 1986. Foaming and emulsifying characteristics of fractionated whey protein. Journal of Food Processing and Preservation 10(2): 81–88. 10.1111/j.1745-4549.1986.tb00008.x
Sodini, I., Morin, P., Olabi, A. and Jiménez-Flores, R., 2006. Compositional and functional properties of buttermilk: a comparison. American Dairy Science Association 89: 525–536. 10.3168/jds.S0022-0302(06)72115-4
Soltani, M., Say, D. and Güzeler, N., 2017. Functional properties and nutritional quality of whey proteins. Journal of International Environmental Application & Science 12(4): 334–338.
Svanborg, S., Johansen, A.G., Abrahamsen, R.K. and Skeie, S.B., 2015. The composition and functional properties of whey protein concentrates produced from buttermilk are comparable with those of whey protein concentrates produced from skimmed milk. Journal of Dairy Science 98(9): 5829–5840. 10.3168/jds.2014-9039
Tcholakova, S., Denkov, N.D., Ivanov, I.B. and Campbell, B., 2006. Coalescence stability of emulsions containing globular milk proteins. Advances in Colloid and Interface Science 123–126: 259–293. 10.1016/j.cis.2006.05.021
Tessier, B., Schweizer, M., Fournier, F., Framboisier, X., Chevalot, I., Vanderesse, R., et al. 2005. Prediction of the amino acid composition of small peptides contained in a plant protein hydrolysate by LC–MS and CE–MS. Food Research International 38(5): 577–584. 10.1016/j.foodres.2004.11.011
Wang, J., Zhao, M., Yang, X. and Jiang, Y., 2006. Improvement on functional properties of wheat gluten by enzymatic hydrolysis and ultrafiltration. Journal of Cereal Science 44: 93–100. 10.1016/j.jcs.2006.04.002
Wouters, A.G.B., Rombouts, I., Fierens, E., Brijs, K. and Delcour, J.A., 2016. Relevance of the functional properties of enzymatic plant protein hydrolysates in food systems. Comprehensive Reviews in Food Science and Food Safety 15: 786–800. 10.1111/1541-4337.12209
Yang, J., Zheng, N., Soyeurt, H., Yang, Y. and Wang, J., 2018. Detection of plant protein in adulterated milk using nontargeted nano-high-performance liquid chromatography-tandem mass spectroscopy combined with principal component analysis. Food Science and Nutrition 7(1): 56–64. 10.1002/fsn3.791