
Download
Enzyme activity U = Δ A × k 0.001 × 1 × t ' 1 DPPH radical scavenging activity % = 1 − A 1 − A 0 A 2 × 100 % , 2 ABTS radical scavenging activity % = 1 − A 1 − A 0 A 2 × 100 % , 3 TYR inhibition rate % = 1 − B 1 − B 2 A 1 × 100 % , 4 AChE inhibition rate % = A 1 − A 2 − B 1 − B 2 A 1 − A 2 × 100 % , 5


PAPER
Development and optimization of ultrasonic extraction of total phenols from fresh peels of Pouteria caimito and its bioactivity evaluation
Jiaojiao Li†*, Zheng Jiang†, Xinxin Li, Xun Gao, Jinyang Shen, Weiran Kong, Qiang Liu, Ruibo Xu*
School of Pharmacy, Jiangsu Ocean University, Lianyungang 222005, China
†Contributed equally.
Abstract
Pouteria caimito Radlk., a tropical plant, manifests potential medicinal properties for treating conditions such as cough, fever, and inflammation. In this study, response surface methodology was employed to optimize the ultrasonic extraction of total phenols from P. caimito peels (CPP). A total of 47 compounds, including seven phenolic compounds, were identified in purified CPP through ultra-high performance liquid chromatography–high resolution mass spectrometry. The biological activities and mechanisms of CPP were also investigated, revealing significant antioxidant activity (IC50(DPPH), 0.0046±0.40 mg/mL; IC50(ABTS), 0.7400±2.90 mg/mL) and enzyme inhibitory effects (IC50(AChE), 1.116±0.76 mg/mL; IC50(TYR), 0.3997±0.56 mg/mL). Network pharmacology analysis further suggested that CPP could exert therapeutic effects in Alzheimer’s disease through modulation of cholinergic synaptic pathways. This study established a scientific foundation for developing P. caimito as a medicinal resource and offered new prospects for drug development in the treatment of neurodegenerative diseases.
Key words: antioxidant activity, network pharmacology, Pouteria caimito, total phenols, ultrasound extraction, UHPLC-HRMS
*Corresponding Authors: Jiaojiao Li and Ruibo Xu, School of Pharmacy, Jiangsu Ocean University, Lianyungang 222005, China. Emails: 2015000009@jou.edu.cn; 2000000035@jou.edu.cn
Academic Editor: Prof. Simone Vincenzi—University of Padova, Italy
Received: 15 November 2024; Accepted: 19 May 2025; Published: 1 July 2025
© 2025 Codon Publications
This is an Open Access article distributed under the terms of the Creative Commons Attribution-NonCommercial-ShareAlike 4.0 International (CC BY-NC-SA 4.0). License (http://creativecommons.org/licenses/by-nc-sa/4.0/)
Introduction
Pouteria caimito Radlk., commonly known as abiu, is an evergreen fruit tree of the Sapotaceae family, native to the upper Amazon region and now widely cultivated across tropical and subtropical zones globally. This species is esteemed for both its edible and therapeutic properties (Silva, 2007). The fruit typically matures between March–April and September–October, presenting as a large, often spherical or oval berry. Its peel ranges from yellow-green to golden yellow on color, while the translucent pulp is soft and creamy in texture (Coronel et al., 1998).
In traditional Brazilian medicine, the fruit is utilized to alleviate symptoms of cough, bronchitis, and other respiratory ailments as well as to treat abscesses and diarrhea (Leung and Flores, 1961; Lim et al., 2013). Phytochemical investigations have revealed that the peel is abundant in bioactive compounds, such as flavonoids (e.g., quercetin, kaempferol, luteolin, and apigenin), triterpenes (e.g., lupeol, α-amyrin, erythrodiol, dammarendiol II, ursolic acid, oleanolic acid, maslinic acid, and hederagenin), polysaccharides, alkaloids, and phenolic compounds (e.g., γ-tocopherol, chlorogenic acid, caffeic acid, and ferulic acid; Abreu et al., 2019; Arif et al., 2022). These constituents have demonstrated pharmacological activities, including gastrointestinal regulation, blood glucose control, and anti-inflammatory effects, underscoring the substantial medicinal potential of P. caimito (Zhao et al., 2024).
Phenolic compounds, a diverse class of natural products, exhibit a broad spectrum of biological activities, drawing significant attention for their medicinal benefits, including anti-tumor, immunomodulatory, cardioprotective, and neuroprotective effects (Liang et al., 2024). Although phenolic compounds have been identified in crude extracts of P. caimito fruit peels (Tuesta et al., 2014), no research has yet explored the extraction process of total phenolics from fresh peels. Furthermore, the specific composition of these compounds remains unclear, and the molecular mechanisms underlying their bioactivities are inadequately understood. Consequently, extracting phenolics from P. caimito and investigating their bioactivities and molecular mechanisms have a significant scientific value and offer a promising direction for the medicinal development of this fruit.
To address these research gaps, the present study aims to (1) employ ultrasonic extraction to isolate total phenolics from P. caimito fruit peel, optimizing the process using response surface methodology (RSM) to maximize extraction efficiency; (2) perform a comprehensive phytochemical analysis of the purified fruit peel phenolics using ultra-high performance liquid chromatography–high resolution mass spectrometry (UHPLC-HRMS) to systematically identify chemical constituents; and (3) assess the antioxidant, tyrosinase (TYR) inhibitory, and acetylcholinesterase (AChE) inhibitory activities of purified phenolics in vitro, and elucidate key AChE inhibitory components and their mechanisms at the molecular level through network pharmacology and molecular docking.
This study not only advances the understanding of P. caimito’s phytochemical composition but also provides a solid scientific foundation for further exploration of its medicinal value, supporting its potential applications in the pharmaceutical industry.
Material and Methods
Materials
Pouteria caimito fruits were purchased in Kunming, Yunnan, China, during September and October 2023. The plant species was authenticated by Dr. Jinyang Shen and identified with reference to Landscape plants: A pictorial guide 2: 680 ornamental trees (Xue and Yang, 2015). Voucher specimens (pc-20230919, pc-20230926, and pc-20231022) were provided by the Pharmacy College at Jiangsu Ocean University, China. The fruits were thoroughly cleaned with running water to remove contaminants from their surfaces. A knife and spoon were used to separate peel from fruit pulp. The peel was placed in a vacuum bag, sealed with a vacuum sealing machine, and stored at –20°C in a refrigerator.
Laboratory reagents
Gallic acid (HPLC ≥ 98%; McLean, Shanghai, China), rutin (HPLC ≥ 98%; McLean, Shanghai, China), anhydrous glucose (HPLC ≥ 98%; McLean, Shanghai, China), AChE from electric eel (HPLC ≥ 98%; McLean, Shanghai, China), TYR (HPLC ≥ 98%; McLean, Shanghai, China), levodopa (L-DOPA; HPLC ≥ 98%; McLean, Shanghai, China), kojic acid (HPLC ≥ 98%; McLean, Shanghai, China), 2-nitrobenzoic acid (DTNB; McLean, Shanghai, China), acetylthiocholine iodide (ATCI; HPLC ≥ 98%; McLean, Shanghai, China), phosphate buffer saline (PBS; pH 6.8–8; McLean, Shanghai, China), taclid (HPLC ≥ 98%; TCI, Tokyo, Japan); catechol (BR ≥ 98%; SCRC, Shanghai, China), trichloroacetic acid (AR ≥ 99%; McLean, Shanghai, China), anhydrous ethanol (EtOH; AR ≥ 99.7%; SCRC, Shanghai, China), methanol (HPLC ≥ 98%; SCRC, Shanghai, China), anhydrous sodium carbonate (AR ≥ 99.8%; SCRC, Shanghai, China), Folin–Ciocalteu reagent (1 mol/L; SCRC, Shanghai, China), potassium persulfate (AR ≥ 99.5%; McLean, Shanghai, China), vitamin C (AR ≥ 99.7%; SCRC, Shanghai, China), 2,2'-azino-bis(3-ethylbenzothiazoline-6-sulfonic acid) diammonium salt (ABTS; HPLC ≥ 98.0%; Aladdin, Shanghai, China), and 2,2-diphenyl-1-picrylhydrazyl (DPPH; HPLC ≥ 97.0%; Aladdin, Shanghai, China).
Experimental instruments
The following instruments were used in the study: ultrasonic cleaning machine (SN-QX-65D; Shanghai Shangpu Instrument Equipment Co. Ltd., China); high-speed refrigerated centrifuge (1580R; GeneSpeed, Korea); vacuum freeze dryer (LGJ-10FD; Beijing Songyuan Huaxing Technology Development Co. Ltd., China); vacuum sealer (FW-3190; Fresh World, China); high-performance liquid chromatograph (Vanquish UHPLC; Thermo Fisher Scientific, IL, USA); quadrupole time-of-flight mass spectrometer (Thermo Scientific Orbitrap Exploris 120; Thermo Fisher Scientific, IL, USA); multifunctional microplate reader (Multiskan FC; Thermo Fisher Scientific, IL, USA); ultraviolet spectrophotometer (TU1901; Beijing Purui General Instrument Co. Ltd., China); rotary evaporator (R1001VN; Zhengzhou Great Wall Science and Trade Co. Ltd., China); electronic balance (BSM120.4; Shanghai Zhuojing Electronic Technology Co. Ltd., China); and constant temperature water bath (ZNCL-GS190*90 mm; Gongyi Yuhua Instrument Co. Ltd., China).
Fresh peel pretreatment experimental design
During the initial phase of the experiment, P. caimito peels (CPP) exhibited rapid browning upon being cut, with rate of browning even surpassing that of banana peel. Numerous studies have established that the browning of banana peel is triggered by polyphenol oxidase (PPO) (Ünal, 2007; Wuyts et al., 2006). It was hypothesized that CPP contained a significant amount of PPO (Wuyts et al., 2006) that catalyzes the oxidation of phenolic compounds to quinones. This process directly affects both extraction rate of total phenols from peels and stability of final extracts. Methods for inactivating PPO include high-temperature treatment (Lin et al., 2012; Terefe et al., 2015), high-pressure treatment (Benito-Román et al., 2019; Terefe et al., 2015), ultraviolet (UV) exposure (Falguera et al., 2012), and addition of inhibitors (Zhou et al., 2015). Among these, high-temperature inactivation is a widely adopted, convenient, efficient, and environment-friendly method (Lin et al., 2012). Consequently, this study employed blanching at 100°C to inactivate PPO. Single-factor experiments were conducted using PPO activity as an indicator to determine optimal blanching time.
Given that a complete vacuum could not be maintained during the subsequent extraction process, and considering that total phenols are prone to oxidation during extraction, antioxidants were incorporated into some studies to mitigate the effects of oxygen on phenolic stability (Han et al., 2023). Common antioxidants include citric acid, glutathione, and sodium sulfite (Na2SO3). Sodium sulfite not only serves as a widely used antioxidant in the biopharmaceutical field but has been extensively studied as a PPO inhibitor as well (Lu et al., 2024). Therefore, Na2SO3 was chosen as the protective agent for extracting polyphenols from CPP in this study. Single-factor experiments were conducted to determine the optimal amount of Na2SO3 based on the extraction rate of total phenols.
Determination of polyphenol oxidase activity
Following the method adopted by Sukhonthara and Theerakulkait (2012) with slight modifications, clean peels were chopped and mixed with PBS buffer (0.1 M, pH 6.8) in 1:40 ratio. The mixture was then crunched into a homogenate and centrifuged at 10,000 rpm for 20 min at –4°C. The resulting supernatant served as a crude extract for measuring PPO activity.
The PPO activity was measured using the method described by the authors Cho et al. (1999), where a substrate solution was prepared by dissolving 0.1-M o-phenylenediamine in PBS buffer (0.1 M, pH 6.8). At 30°C, 1 mL of enzyme solution was mixed with 2 mL of substrate solution, and absorbance changes were measured at 420 nm over a 10-min period. One unit of enzyme activity (U) was defined as the amount of enzyme required to produce a change of 0.001 in absorbance per minute under the specified assay conditions:
where ΔA represents the change in absorbance, k is the dilution factor, 1 corresponds to the volume of 1 mL of enzyme solution used in the reaction, and t is the reaction time in minutes.
Single-factor experiment on blanching time of peels
An appropriate amount of fruit peels was placed in a vacuum preservation bag, air was evacuated, and the bag was sealed. The peels were then blanched in a water bath at 100°C for 0–10 min. After blanching, PPO content and enzyme activity of peels were measured following the method outlined in Section 2.4.1. Next, the peels were extracted using 70% EtOH as solvent in the dark. The extraction was performed with 480-W ultrasonic power, a solid–liquid ratio of 1:30, and an ultrasound temperature of 50°C for 30 min. The extract was filtered, and the process was repeated thrice. The three filtrates were combined and concentrated under reduced pressure to a final volume of 50 mL, and the total phenol yield was determined using the Folin–Ciocalteu assay.
Single factor experiment on sodium sulfite concentration
After blanching, the peels were cooled, cut into small pieces roughly the size of mung beans, mixed thoroughly, and placed in vacuum preservation bags. These bags were evacuated, sealed, and stored at -20°C for later use. Sodium sulfite aqueous solution was prepared with concentrations ranging from 0.1% to 2%, with a specific concentration of 1 g/mL used in extraction. The extraction process was conducted in the dark with 70% EtOH as solvent under 480-W ultrasonic power, a solid–liquid ratio of 1:30, and an ultrasound temperature of 50°C for 30 min. The extraction was repeated thrice, and the combined filtrates were concentrated under reduced pressure and adjusted to a final volume of 50 mL. The total phenol yield was again determined using the Folin–Ciocalteu assay.
Extraction and purification of total phenols from CPP
Extraction of CPP
As described in Section 2.4, the peels underwent pretreatment. The liquid-to-solid ratio, extraction temperature, ultrasonic time, number of extractions, and EtOH concentration were varied according to experimental design. Extraction was carried at 480-W ultrasonic power in the dark. After ultrasonic extraction, the extract was filtered under negative pressure, and the filtrate, which contained CPP, was collected for yield determination.
Single-factor experiment
Single-factor experiments were conducted using EtOH as solvent to investigate the effects of five variables on the yield of CPP: EtOH concentration (10%, 20%, 30%, 40%, 50%, and 60%), liquid-to-solid ratio (10, 20, 30, 40, and 50 mL/g), extraction temperature (20, 30, 40, 50, 60, and 70°C), ultrasonic time (10, 20, 30, 40, 50, and 60 min), and extraction times (1, 2, 3, 4, and 5 times). All experiments were performed in triplicate.
Plackett–Burman (PB) experiment
In the CPP extraction process, several factors, such as ultrasonic time, ultrasonic temperature, and extraction frequency, may influence extraction efficiency. These factors may interact with one another, although not all significantly affect the extraction yield. The PB experimental design is an efficient screening method that allows for the rapid identification of key factors that significantly impact extraction efficiency with a limited number of experiments, thereby avoiding unnecessary investigation of non-critical factors (Fazil et al., 2024). Based on the results of single-factor experiments, the experimental factor levels were determined, and the PB experiment was conducted using PB module in the Design-Expert 8.0.6.1 software. The PB design with n = 12 was employed, using the extraction yield of CPP as a response variable to screen for factors influencing CPP extraction rate. The experimental design for PB experiment is provided in Supporting Information (Table S1).
Steepest ascent/descent experiment
In multi-factor optimization experiments, the steepest ascent method is an effective approach to identify the region of multi-factorial space containing optimal response value and quickly approaching maximum response point. In this study, based on the results of PB experimental design, significant factors affecting the response variable were identified, and the steepest ascent/descent path was established. By conducting steepest ascent/descent experiments along this path, the factor levels were systematically adjusted until the response value reached the maximum region. The maximum response value obtained served as the center point for subsequent Box–Behnken design (BBD) experiments, providing a well-defined starting region for response surface experimentation. This method not only swiftly narrows down the experimental range, reducing the number of experiments and associated costs, but also enhances the efficiency and accuracy of subsequent response surface experiments (Liu et al., 2011). The detailed path of the steepest ascent/descent experiment is presented in Supporting Information.
Box–Behnken design experiment
BBD, using the Design-Expert 8.0.6.1 software, was employed to design experimental data. Based on the results of single-factor experiment and the steepest ascent/descent experiment, a three-factor, three-level response surface analysis was performed to optimize extraction conditions. EtOH concentration, extraction temperature, and extraction frequency were chosen as three independent variables, and the amount of CPP extracted was measured as the response variable (R). CPP extraction was performed under optimal conditions identified by BBD, and the experimental values under these conditions were compared to the predicted values of the model.
Purification of CPP
Purification of CPP was conducted under optimal extraction conditions determined by BBD. AB-8 resin was saturated with EtOH and then carefully transferred to a column (26 mm × 457 mm). The column was eluted with water, and 0.5 bed volume (BV) of CPP was loaded onto the column at a flow rate of 2 BV/h. After allowing for adsorption for 1 h in the dark, the column was sequentially eluted with 1 BV of water, followed by 2.5 BV of 50% EtOH solution, both conducted at a flow rate of 2 BV/h. The eluates were collected in 10-mL tubes. The collection tubes containing total phenols were combined, concentrated, and freeze-dried, resulting in the purification of CPP (Aghdam et al., 2020).
Method for Analyzing CPP
Total Phenolic Content (TPC)
In order to quantify TPC, plant extracts at varying concentrations were added to the Folin–Ciocalteu phenol reagent (1 mol/L, 2 mL) and mixed thoroughly using a vortex mixer. The mixture was incubated at 37°C for 8 min, with addition of sodium carbonate solution (10%, 3 mL). The total volume was adjusted to 10 mL with deionized water. After vortexing again, the mixture was incubated for an additional 1½ h at 37°C. Absorbance was measured at 745 nm using a spectrophotometer. The results were expressed as milligrams of gallic acid equivalent per gram of extract (mg GAE/g) (Rumpf et al., 2023).
Total Flavonoid Content
To quantify total flavonoid content, plant extracts at varying concentrations were added to sodium nitrite solution (5%, 0.4 mL) and incubated at room temperature for 6 min. Then aluminum nitrate solution (10%, 0.4 mL) was added, and the mixture was incubated for an additional 6 min. Sodium hydroxide solution (4%, 4 mL) was subsequently incorporated, and the total volume was adjusted to 10 mL with deionized water. The mixture was vortexed thoroughly, and after 15 min, absorbance was measured at 510 nm. Flavonoid content was quantified as milligrams of quercetin equivalent per gram of extract (mg QE/g) (Leyva et al., 2008).
Total Polysaccharide Content (TSC)
For the determination of total carbohydrates, plant extracts at varying concentrations were added to anthrone-sulfuric acid solution (4 mL, 0.2%) and mixed thoroughly using a vortex mixer. The mixture was heated in a water bath at 100°C for 15 min and cooled in an ice bath for 10 min. Absorbance was measured at 625 nm. The results were expressed as milligrams of glucose equivalent per gram of extract (mg GE/g) (Rumpf et al., 2023).
In vitro activity study
DPPH radical scavenging capacity
First, 50 µL of each diluted sample was mixed with 200 µL of DPPH solution in methanol (0.2 mM) and incubated in the dark for 40 min. The absorbance of the mixture was measured at 517 nm, the maximum absorption wavelength (Pandey et al., 2018). For the control, 50 µL of anhydrous methanol was added instead of the sample, and its absorbance was recorded. The DPPH radical scavenging activity was calculated using Equation (2):
where A1 represents absorbance of the test sample, A2 is absorbance of the blank, and A0 is absorbance of the control.
ABTS•+ radical scavenging capacity
For ABTS radical scavenging activity, ABTS reagent (7 mM) was mixed with potassium persulfate solution (2.45 mM) and incubated at -4°C for 16 h in the dark to prepare ABTS free radical stock solution. The stock solution was then diluted with anhydrous EtOH until the absorbance reached 0.7±0.02 Absorbance units. The diluted solution was further diluted with water, and 190 µL of this solution was combined with 10 µL of sample. After 10 min, absorbance was measured at 734 nm (Guo et al., 2020). The control was prepared by replacing the sample with 10 µL of anhydrous EtOH, and its absorbance was recorded. The ABTS radical scavenging activity was calculated using Equation (3):
where A1 represents absorbance of the test sample, A2 is absorbance of the blank, and A0 is absorbance of the control.
In vitro tyrosinase inhibitory activity
For TYR inhibitory activity, 40 µL of the sample was combined with 60 µL of PBS (pH 6.8) and 20 µL of TYR solution (100 U/mL in PBS). After incubation at 37°C for 8 min, 20 µL of L-DOPA solution (0.2 mg/mL in PBS) was added, followed by an additional incubation at 37°C for 15 min. Absorbance was measured at 475 nm (Chaudhary et al., 2023). The TYR inhibition rate was calculated according to Equation (4):
where B1 is absorbance of the entire reaction mixture, B2 is absorbance when TYR solution is replaced by PBS, and A1 is absorbance when the sample is substituted with PBS.
In vitro acetylcholinesterase inhibitory activity
In order to evaluate AChE inhibitory activity, 20 µL of samples were combined with 50 µL of DTNB solution (10 mM in PBS) and 20 µL of AChE solution (0.2 U/mL in PBS). After incubation at 37°C for 15 min, 20 µL of ATCI solution (10 mM in PBS) was added, followed by an additional 25-min incubation at 37°C, with absorbance measured at 412 nm (Chaudhary et al., 2023). AChE inhibition was calculated using Equation (5):
where B1 represents absorbance of all reaction mixtures at 412 nm; B2 denotes absorbance when the AChE solution is replaced with PBS; A1 indicates absorbance when the sample is replaced with PBS; and A2 refers to absorbance when both sample and AChE solution are replaced with PBS.
UHPLC-HRMS analysis
Purified CPP was accurately weighed, dissolved in a methanol–water mixture, and subjected to ultrasonic extraction for 30 min, followed by centrifugation. The supernatant was filtered through a membrane filter and prepared for instrumental analysis, with the final sample concentration determined to be 458 ppb.
Ultra-performance liquid chromatography (UHPLC) analysis of the purified CPP was performed on a Vanquish system with a diode array detector, coupled with a Thermo Scientific Orbitrap Exploris 120 mass spectrometer. Chromatographic separation utilized a Hypersil GOLD aQ column (100 × 2.1 mm, 1.9 μm), maintained at 40°C. Mobile phases consisted of (A) 0.1% formic acid in water and (B) 0.1% formic acid in acetonitrile, with a flow rate of 0.3 mL/min. The elution gradient was optimized as follows: 0.0–2.0 min (5% A: 95% B), 2.0–42.0 min (5-95% A: 95-5% B), 42.0–47.0 min (95% A: 5% B), and 47.1–50.0 min (5% A: 95% B).
CPP purification was analyzed in both positive and negative ionization modes using Mass Spectrometry (MS/MS) product ion scanning within the 50–1,500 Dalton range. Ion source parameters were as follows: capillary temperature 320°C; ion spray voltage +3.5 kV for positive ion mode and −3.2 kV for negative ion mode; probe heater temperature 350°C; shaped lens at 60%; scan mode set to full data-dependent mass spectrometry (MS-ddMS2); and stepped normalized collision energy at 20, 40, and 60.
For data analysis, raw data were imported into Compound Discoverer 3.3 for peak extraction and alignment. High-resolution data acquired from the Orbitrap enabled precise determination of isotopic peaks and the fitting of potential molecular formulas. Extracted accurate mass-to-charge ratios and molecular formula information were then used for online searches in ChemSpider database, broadening the compound identification process. Furthermore, the mass spectra of the samples were compared with reference spectra from online databases, such as mzCloudTM, and local spectral libraries such as mzVault, to confirm compound structures. The mzCloud Best Match score reflects similarity between experimental mass spectra and reference spectra, with higher scores indicating closer matches. DeltaMass (ppm) quantifies deviation between measured and theoretical masses, with lower values indicating greater accuracy. Based on these criteria, a mzCloud Best Match score ≥95 and an Annot. DeltaMass (ppm) ≤ ±5 were selected for compound identification in this study (Di Trana et al., 2021).
Network pharmacology analysis
Screening predictions of target compounds
Compounds were retrieved from the PubChem database (https://pubchem.ncbi.nlm.nih.gov/) and saved in SDF format. Target prediction for the compounds was performed using the Swiss Target Prediction database (http://swisstargetprediction.ch/). The probability value indicates the likelihood that a predicted target is a true target, reflecting strength and reliability of the interaction between compound and target. A higher probability value suggests greater structural similarity between compound and target, enhancing the prediction’s reliability (Daina et al., 2019). Thus, a Probability threshold of 0.5 as the screening criterionfor identifying relevant targets.
Prediction of targets for disease
Potential therapeutic targets related to the disease were searched using GeneCards (https://www.genecards.org/), DrugBank (https://go.drugbank.com/), OMIM (https://www.omim.org/), and TTD (https://db.idrblab.net/ttd/). Targets with relevance scores of 50 or higher were selected to obtain more pertinent targets (Gfeller et al., 2014), and duplicates were removed.
Construction of the protein–protein interaction (PPI) Network
The Venny 2.1 software (https://bioinfogp.cnb.csic.es/tools/venny/index.html) was used to identify overlapping targets between compound- and disease-related targets. The potential targets of the compounds for treating Alzheimer’s disease (AD) were imported into the STRING database (https://string-db.org/cgi/input.pl), where the protein type was set to ‘Homo sapiens’, and PPI network data were generated.
Gene biological processes (BP) and Kyoto Encyclopedia of Genes and Genomes (KEGG) pathway enrichment analysis
In network pharmacology, KEGG pathway analysis elucidates the functions and interactions of targets within metabolic and signaling pathways, while gene ontology (GO) BP analysis identifies the potential roles of targets in biological contexts. Therefore, KEGG pathway and GO BP analyses were employed to explore the potential pharmacological mechanisms of CPP (Wang et al., 2024). The core targets identified in this study were imported into the Metascape website (https://www.metascape.org/) for KEGG and GO analyses using the default parameters of the site.
Molecular docking
Molecular docking is a key technique in drug design that analyzes receptor characteristics and the interaction between receptors and drug molecules. It focuses on the behavior of biologically active molecules and their corresponding receptors, predicting their binding modes and strengths (Wang et al., 2020). In this study, molecular docking was employed to investigate binding modes and interaction mechanisms between the key active ingredients of CPP and disease-related targets.
Molecular docking simulations were carried out using the Molecular Operating Environment (MOE 2015.10) software. Protein structures were selected based on previous research (Pant et al., 2024), with donepezil and tacrine serving as reference compounds. The crystal structures of core target proteins were obtained from the Protein Data Bank (PDB: 4EY7; https://www.rcsb.org/), and ligand structures were retrieved from PubChem (https://pubchem.ncbi.nlm.nih.gov/). Ligand structures were then converted to PDB format using the OpenBabel v2.3.1 software. The docking protocol followed a previously established methodology (Ajala et al., 2022). All compounds were subjected to the same docking protocols and parameters to ensure comparability of the results.
Data statistics and analysis
All experiments were performed in triplicate, except for the network pharmacology analysis. Data analysis and graphical representation were conducted using GraphPad Prism 8. Statistical analysis for each dataset was performed, with results presented as mean±standard deviation (SD). A one-way analysis of variance (ANOVA) was followed by a t-test for further evaluation. Statistical significance was defined as p < 0.05.
Results and Discussion
Pretreatment of peels
As shown in Table 1 (entries 1–6), CPP contains a high concentration of PPO, with an activity level of 432±0.2494 U. As blanching time increases, PPO activity declines significantly and is completely inactivated after 3 min. Concurrently, the CPP extraction rate increases initially and then decreases. This trend may be attributed to the reduced destructive effect on polyphenols following PPO inactivation, which increases CPP extraction rate, peaking at 2 min. However, with further blanching, higher temperature damages the polyphenol structure, resulting in reduced CPP extraction rate. Therefore, to ensure complete PPO inactivation while maximizing CPP retention, a blanching time of 3 min was identified as optimal.
Table 1. Pretreatment experimental design and results.
| Entry | Blanching time (min) | Na2SO3concentration (mg/mL) | PPO activity (U) | TPC (mg/g) |
|---|---|---|---|---|
| 1. | 0 | 0 | 432±0.25 | 4.022±0.02 |
| 2. | 1 | 0 | 208±0.42 | 4.950±0.03 |
| 3. | 2 | 0 | 52±0.32 | 5.800±0.02 |
| 4. | 3 | 0 | 0 | 5.316±0.01 |
| 5. | 4 | 0 | 0 | 4.887±0.02 |
| 6. | 5 | 0 | 0 | 4.575±0.01 |
| 7. | 3 | 2 | / | 5.440±0.09 |
| 8. | 3 | 4 | / | 6.345±0.21 |
| 9. | 3 | 6 | / | 7.996±0.12 |
| 10. | 3 | 8 | / | 8.102±0.23 |
| 11. | 3 | 10 | / | 10.40±0.20 |
| 12. | 3 | 12 | / | 6.950±0.11 |
| 13. | 3 | 14 | / | 6.903±0.29 |
| 14. | 0 | 10 | / | 8.241±0.12 |
Note: In the experiment, the material-to-liquid ratio of the sample and Na2SO3 solution was maintained at a liquid-to-solid ratio of 1:1 (mL/g).
As presented in Table 1 (entries 7–13), the CPP extraction rate initially increases and then decreases as Na2SO3 concentration increases. The highest extraction rate of total phenols occurs at a sodium sulfite concentration of 1%. This may be due to sodium sulfite’s protective effect on polyphenolic compounds, preventing oxidation during extraction and enhancing the CPP extraction rate. However, once oxygen in the extraction container is depleted, excess Na2SO3 reacts with phenolic compounds to form sulfites, reducing total phenol yield (Castro-Godoy et al., 2019). Therefore, a sodium sulfite concentration of 1% was found to be optimal for extraction.
Thus, the optimal pretreatment conditions identified in this study were blanching at 100°C for 3 min, followed by the addition of 1% Na2SO3 (1 mL/g, V/M). To further evaluate the effect of pretreatment on total phenol extraction, four conditions were compared: no pretreatment, blanching for 3 min only, addition of Na2SO3 only, and addition of Na2SO3 after blanching for 3 min. As illustrated in Table 1 (entries 1, 4, 13, and 14), pretreatment increased CPP extraction rate from 4.202 mg/g (no pretreatment) to 10.540 mg/g. These results conclusively demonstrated that pretreatment significantly enhanced CPP extraction.
Extraction and purification of CPP
Single-factor experiments
Ultrasonic time
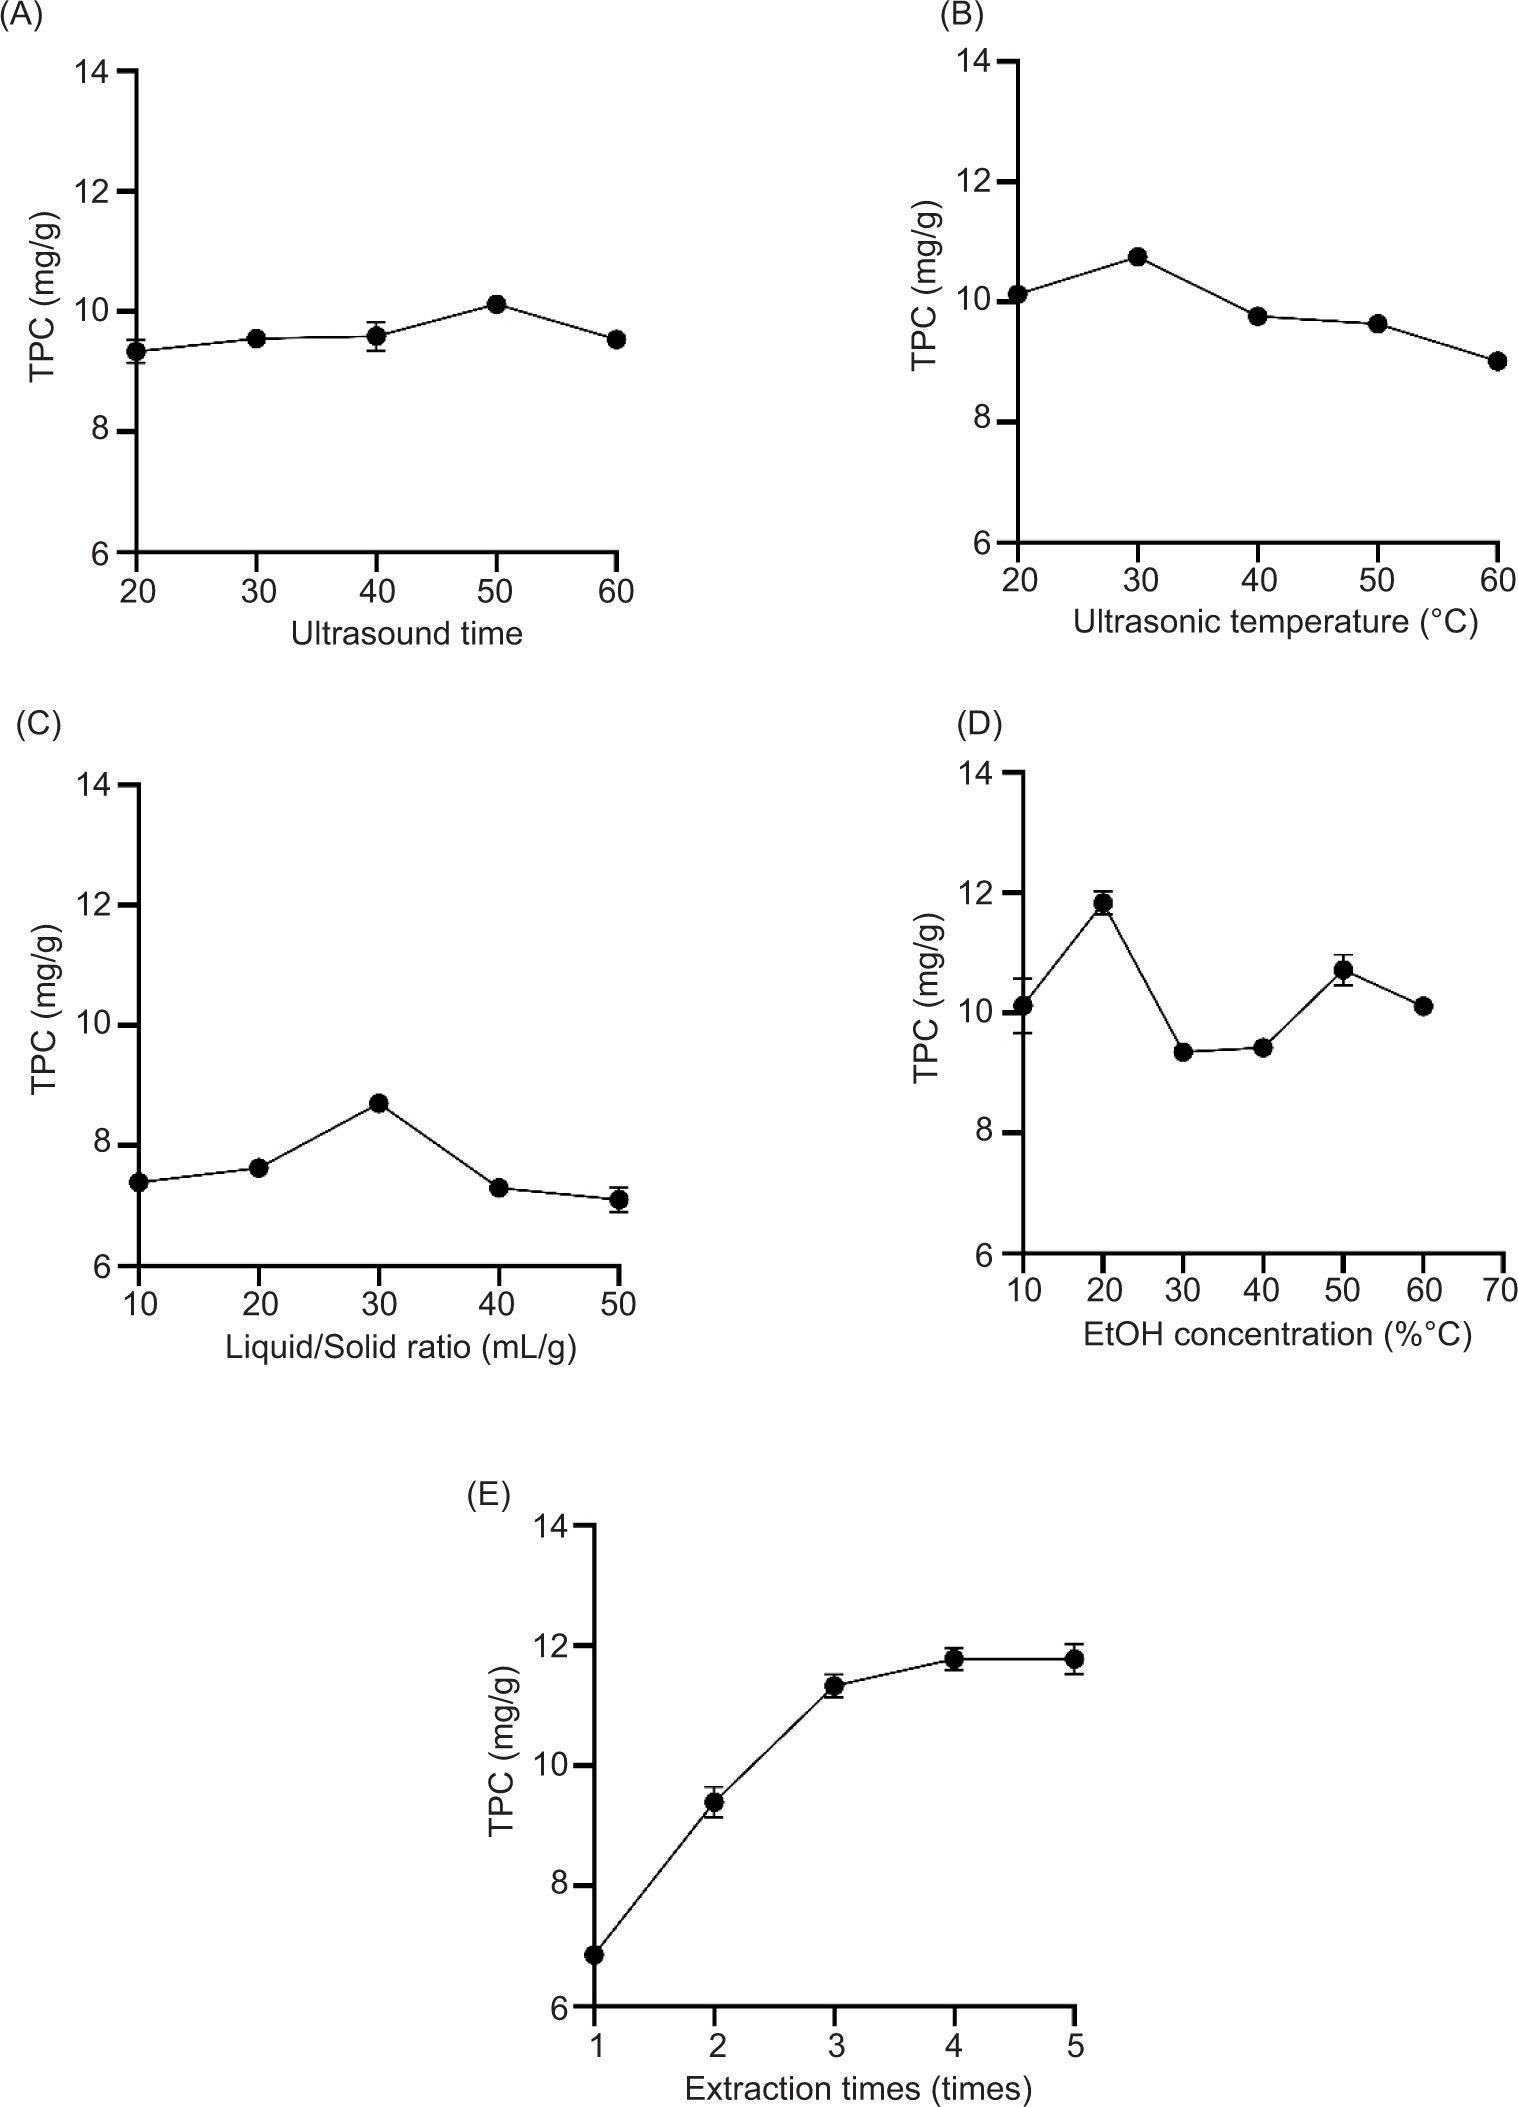
As shown in Figure 1A, the total phenol yield increased initially and then decreased with the extension of extraction time. Compared to conventional natural product extraction methods (Wang et al., 2024), the extraction time in this experiment reached 50 min, during which the maximum total phenol yield was achieved. This phenomenon may be attributed to fresh and uncrushed peels used in this study, which were thicker and had a smaller contact surface area with solvent during extraction. Therefore, 50 min was chosen as the optimal extraction time for this experiment.
Figure 1. Effects of (A) ultrasonic time, (B) ultrasonic temperature, (C) liquid-to-solid ratio, (D) EtOH concentration, and (E) extraction time on TPC.
Ultrasonic temperature
As presented in Figure 1B, the total phenol yield increased and then decreased with increasing temperature, reaching a maximum extraction rate of 10.80 mg/mL at 30°C. As temperature increased, solvent’s viscosity and surface tension decreased, promoting the extraction process. However, beyond the optimal temperature, the desired components begun to degrade due to the formation and collapse of larger cavitation bubbles, which induced shear stress (Naseem et al., 2021). Additionally, elevated temperatures could cause solvent volatilization, reducing the amount of solvent actively involved in extraction. This resulted in lower extraction efficiency due to the decomposition of total phenols (Omar and Sadeghi, 2022). Therefore, 30°C was selected as optimal extraction temperature for this study.
Liquid-to-solid ratio
As shown in Figure 1C, the total phenol yield increased initially and then decreased with increase in liquid-to-solid ratio, with the highest phenol content (8.7 mg/g) observed at a ratio of 30 mL/g. This could be due to larger liquid-to-solid ratio, which enhanced the contact area between solvent and sample, facilitating the dissolution of phenolic compounds. However, further increase in liquid-to-solid ratio lead to the dissolution of other substances, such as pigments, which compete with total phenols for the solvent, as observed in previous studies on C. alba (Wang et al., 2024). Thus, a liquid-to-solid ratio of 30 mL/g was identified as optimal when other conditions being fixed.
EtOH concentration
As shown in Figure 1D, TPC exhibited two peaks with varying EtOH concentrations. The highest TPC of 11.83 mg/g was achieved at 20% EtOH concentration. Although the total phenol yield at 50% EtOH concentration reached 10.72 mg/g, it was still lower than that at 20% EtOH concentration. This could be due to the fact that water-soluble phenols are more readily extracted at 20%, while at 50%, the extraction predominantly involves fat-soluble phenols, such as flavonoids, with a reduction in water-soluble phenols. Consequently, the total phenol yield decreases at higher EtOH concentration. Considering both yield and environmental factors, a 20% EtOH concentration was selected as optimal for extraction in this experiment.
Extraction time
Figure 1E shows that the total phenol extraction rate increased with the number of extractions. However, after three extractions, there was little change in extraction rate with additional extractions. To balance extraction efficiency and environmental concerns, three extractions were chosen as optimal in this study.
Box–Behnken Experiment
Following the results of PB trials and the steepest ascent/descent experiments (see Supporting Information Tables S1, S2, and S3 for detailed results and discussions), a BBD response surface methodology was applied to optimize the extraction conditions of total phenolics from CPP using ultrasound extraction. In all, 17 different combinations of the investigated variables were tested. Experimental design and results are presented in Table 2. A multiple quadratic regression analysis of the experimental data yielded the following response surface model, which was used to predict total phenolic extraction yield based on different extraction parameters:
Y = 15.61+ 2.21A + 0.19B + 4.21C + 0.78AB + 0.77AC + 0.62BC + 2.39A2 + 4.62B2 + 2.65C2,(6)
where Y is the extraction yield of CPP, A is the ultrasonic temperature, B is the EtOH concentration, and C is the extraction time.
Table 2. Box–Behnken design (BBD) and the extraction yield of CPP.
| Run | A | B | C | TPC (mg/g) |
|---|---|---|---|---|
| 1 | 0 | –1 | 1 | 13.64±0.48 |
| 2 | –1 | 0 | –1 | 3.870±0.10 |
| 3 | –1 | –1 | 0 | 4.522±0.20 |
| 4 | 0 | 0 | 0 | 15.10±0.56 |
| 5 | 1 | –1 | 0 | 11.25±0.29 |
| 6 | 1 | 0 | 1 | 15.74±0.18 |
| 7 | 0 | 0 | 0 | 15.23±0.21 |
| 8 | 0 | –1 | –1 | 3.750±0.35 |
| 9 | 0 | 0 | 0 | 15.72±0.61 |
| 10 | –1 | 0 | 1 | 13.60±0.02 |
| 11 | 1 | 1 | 0 | 11.14±0.37 |
| 12 | 0 | 1 | 1 | 11.69±0.43 |
| 13 | 1 | 0 | –1 | 9.070±0.15 |
| 14 | –1 | 1 | 0 | 7.530±0.15 |
| 15 | 0 | 0 | 0 | 16.20±0.03 |
| 16 | 0 | 0 | 0 | 15.82±0.11 |
| 17 | 0 | 1 | –1 | 4.291±0.26 |
Note: The experiment employed BBD with the following factor levels: A: –1 = 24°C, 0 = 28°C, +1 = 32°C; B: –1 = 9.5%, 0 = 14%, +1 = 18.5%; C: –1 = 2, 0 = 3, +1 = 4.
The model’s statistical significance was assessed with ANOVA, confirming that the model was reliable, well-fitted, and exhibited minimal error, effectively capturing the relationships between extraction process parameters. The actual extraction yield showed strong alignment with the predicted values. Factors A and C displayed highly significant differences, highlighting the considerable impact of ultrasonic temperature and extraction time on the extraction process.
The interaction between two independent variables was visually represented through three-dimensional (3D) response surface plots and 2D response contour plots. The 3D response surface plot illustrates the mutual influence of independent variables on response variable, while the 2D contour plot highlights both reciprocal interaction and significance of this interaction. A circular contour plot suggests negligible interaction between corresponding variables, while an elliptical contour plot indicates a significant interaction. The 3D response surface plots further convey the strength of interaction among experimental factors, with steeper and more curved surfaces indicating a higher degree of interaction (Wang et al., 2024).
Figures 2A–C depict the influence of each of the three extraction parameters on extraction rate. All three contour plots display a near-circular shape, suggesting that the interactions between variables are minimal, and thus their effects can be considered insignificant. This finding aligns with the results shown in Table 3, where the p-values for interaction coefficients AB, AC, and BC are greater than 0.05. Additionally, the three response surface plots exhibit varying degrees of curvature. Notably, the plots for variables A and C show a steeper curvature, while the plot for variable B is relatively flat. This observation is consistent with the p-value analysis shown in Table 3, which identifies A and C as significant factors affecting the CPP extraction rate.
Figure 2. Response surfaces of TPC for optimization. Influence of: (A) ultrasonic temperature and EtOH concentration, (B) extraction time and EtOH concentration, and (C) extraction time and ultrasonic temperature.
Table 3. Fitted quadratic polynomial model from ANOVA.
| Soure | Sum of squares | Df | Mean square | F-value | p-value | Saliency | |
|---|---|---|---|---|---|---|---|
| Model | 345.63 | 9 | 38.40 | 62.01 | <0.0001 | *** | |
| A | 39.03 | 1 | 39.03 | 63.03 | <0.0001 | *** | |
| B | 0.2758 | 1 | 0.2758 | 0.4454 | 0.5259 | / | |
| C | 141.83 | 1 | 141.83 | 229.03 | <0.0001 | *** | |
| AB | 2.44 | 1 | 2.44 | 3.93 | 0.0878 | / | |
| AC | 2.34 | 1 | 2.34 | 3.79 | 0.0928 | / | |
| BC | 1.55 | 1 | 1.55 | 2.51 | 0.1573 | / | |
| A2 | 24.02 | 1 | 24.02 | 38.79 | 0.0004 | *** | |
| B2 | 89.69 | 1 | 89.69 | 144.83 | <0.0001 | *** | |
| C2 | 29.68 | 1 | 29.68 | 47.92 | 0.0002 | *** | |
| Residual | 4.33 | 7 | 0.6193 | / | / | / | |
| Lack of fit | 3.54 | 3 | 1.18 | 5.93 | 0.0593 | Not significant | |
| Pure error | 0.7963 | 4 | 0.1991 | / | / | / | |
| Cor total | 349.96 | 16 | / | / | / | / | |
| R2 | 0.9876 | / | / | / | / | / | |
| R2adjusted | 0.9717 | ||||||
Notes: Significance levels: p > 0.05 (no significant difference), ***p < 0.001 (highly significant difference). Model evaluation: R2 is coefficient of determination (representing explained variance; values closer to 1 indicate improved predictive performance); R2adjusted is adjusted coefficient of determination R2 (accounting for model complexity; values near 1 indicate robustness against overfitting).
Based on the experimental data, the optimal extraction conditions were determined through the Design Expert software optimization analysis. To ensure practical operability and equipment precision, the experimental conditions were adjusted accordingly, followed by three parallel experiments. The results, presented in Table 4, show that the theoretical extraction rate was 17.343 mg/g, while the actual extraction rate was 17.078±0.3919 mg/g, with a relative deviation of 1.53%. This demonstrates that the response surface optimization model closely aligns with the actual extraction results, confirming its strong fitting capability and reliability.
Table 4. Simulated TPC maxima and optimized actual TPC values along with associated parameters.
| Ultrasonic temperature (°C) | EtOH concentration (%) | Extraction time (times) | TPC (mg/g) | |
|---|---|---|---|---|
| Simulated | 28.681 | 13.028 | 3.701 | 17.343 |
| Actual | 29.000 | 13.000 | 4.000 | 17.078±0.3919 |
Note: TPC: total phenolic content; EtOH: anhydrous ethanol.
Purification of CPP
To systematically assess impact of the purification process on the active components of CPP, the purity of primary active substances was measured before and after purification. As shown in Table 5, polyphenol purity significantly increased from 9.78%±0.06% to 30.00%±0.81%. This substantial improvement was primarily due to the removal of flavonoids and polysaccharides during the purification process, which considerably lowered their proportion in CPP extract.
Table 5. Comparison of purity of total phenols, polysaccharides, and flavonoids in the polyphenolic extract of CPP before and after purification.
| Sample | Polyphenol purity (%) | Flavonoids purity (%) | Polysaccharides purity (%) |
|---|---|---|---|
| Crude extract | 9.780±0.06 | 11.84±0.16 | 51.20±1.4 |
| AB-8 purified | 30.00±0.81 | 2.230±0.02 | 14.57±0.09 |
Note:
In vitro activity study
In vitro antioxidant activity
The DPPH and ABTS radical scavenging abilities of purified CPP and the control sample (Vc) at varying concentrations (0.0100–4.0000 mg/mL) are presented in Figures 3A,B, with corresponding IC50 values shown in Table 6. Both purified CPP and Vc exhibited dose-dependent scavenging activities against DPPH and ABTS radicals. In the DPPH radical scavenging assay, purified CPP demonstrated strong activity, with an IC50 value of 0.0046±0.40% mg/mL, significantly lower than that of Vc (IC50 DPPH = 0.2000±0.44% mg/mL). In contrast, CPP exhibited weaker scavenging activity against ABTS radicals (IC50 ABTS = 0.7400±2.9% mg/mL). These discrepancies were attributed to the distinct antioxidative mechanisms of free radicals, with DPPH radical scavenging primarily involving hydrogen atom transfer, while ABTS radical scavenging primarily involving single-electron transfer, as noted in the literature (Qin et al., 2025).
Figure 3. In vitro activity: (A) DPPH, Cpurified CPP = 0.05–2.00 mg/mL, CVc = 0.01–0.50 mg/mL; (B) ABTS, Cpurified CPP = 0.10–4.00 mg/mL, CVc = 0.05–1.50 mg/mL; (C) TYR, Cpurified CPP = 0.25–3.00 mg/mL, Ckojic acid = 0.025–3.00 mg/mL; (D) AChE, Cpurified CPP = 0.25–4.50 mg/mL, Ctacrine = 0.25–4.50 mg/mL, Cdonepezil = 0.25–4.50 mg/mL.
Table 6. In vitro evaluation of the bioactivities of purified CPP.
| Assays | DPPH scavenging | ABTS scavenging | In vitro AChE inhibitory | In vitro TYR inhibitory |
|---|---|---|---|---|
| IC50 (mg/mL) | IC50 (mg/mL) | IC50 (mg/mL) | IC50 (mg/mL) | |
| CPP | 0.0046±0.40% | 0.7400±2.90% | 1.1160±0.76% | 0.3997±0.56% |
| Vc | 0.0200±0.44% | 0.2224±0.86% | / | / |
| Kojic acid | / | / | / | 0.0812±1.62% |
| Tacrine | / | / | 0.6154±3.68% | / |
| Donepezil | / | / | 0.2256±0.71% | / |
Note: CPP: P. caimito peels; Vc: control sample; IC50: inhibitory concentration 50; TYR: tyrosine; AChE: acetylcholinesterase.
These results highlight the potential of purified CPP as a potent antioxidant, offering broad application prospects across various industries. In the pharmaceutical sector, oxidative stress induced by free radicals lead to cellular damage and dysfunction, contributing to the development and progression of several diseases, including cardiovascular diseases, neurodegenerative disorders, and cancer. Thus, CPP’s radical scavenging ability holds promise for the prevention and treatment of these conditions. In the food industry, antioxidants are widely used to prevent oxidation and spoilage, extend shelf life, and produce functional foods. Given its potent free radical scavenging activity, CPP’s application in the food industry presents significant potential.
In Vitro TYR inhibitory activity
The TYR inhibitory activity of purified CPP and the control sample (kojic acid) at varying concentrations is shown in Figure 3D, with the corresponding IC50 values provided in Table 6. The results indicate that, within the concentration range of 0.2500–3.0000 mg/mL, the inhibitory activity of purified CPP against TYR increased significantly with concentration, yielding an IC50 value of 0.3997±0.56% mg/mL. While this value is higher than that of positive control (kojic acid, IC50 TYR = 0.0812±1.62% mg/mL), it still demonstrates considerable inhibitory potential.
Tyrosinase is a key rate-limiting enzyme in the synthesis of melanin, and TYR inhibitors have broad application potential in the pharmaceutical and cosmetic industries (Wu et al., 2025). In the pharmaceutical sector, TYR inhibitors are critical for the treatment of skin diseases, such as melanoma (Chai et al., 2023; Logesh et al., 2023). By inhibiting melanin production, these inhibitors may serve as novel therapeutic agents for melanoma and related skin pigmentation disorders. Additionally, TYR inhibitors could offer adjunctive therapeutic benefits in the treatment of neurodegenerative diseases (Carcelli et al., 2020). In the cosmetic industry, TYR inhibitors are primarily utilized in whitening and anti-aging products, where they reduce melanin production by inhibiting TYR activity, leading to whitening effects (Wang et al., 2023).
Given that CPP has shown strong inhibitory activity against TYR in vitro, it presents a promising candidate for TYR inhibition, with potential applications in both cosmetic and pharmaceutical industries.
In vitro AChE inhibitory activity
The AChE inhibitory activity of purified CPP and control samples at various concentrations is presented in Figure 3C, with the corresponding I C50 values shown in Table 6. As illustrated in Figure 3C and Table 6, purified CPP exhibits a concentration-dependent inhibitory effect on AChE within the concentration range of 0.2500–4.5000 mg/mL, with an IC50 value of 1.1160±0.76 mg/mL. Compared to positive controls (tacrine, IC50 = 0.6154±3.68 mg/mL; donepezil, IC50 = 0.2256±0.71 mg/mL), the inhibitory activity of purified CPP is relatively weaker. This could be attributed to the presence of various chemical components in CPP, some of which may exert inhibitory effects on AChE, while others may be inactive or even antagonistic, leading to a less potent overall effect than that of the single-active ingredient positive controls.
AChE is a critical enzyme in cholinergic synapses, terminating neurotransmitter signaling by catalyzing the hydrolysis of acetylcholine (ACh). This process is essential for maintaining functional balance between the peripheral and central nervous systems (Marucci et al., 2021). Clinically, peripheral AChE inhibitors are used primarily for neuromuscular transmission disorders, such as myasthenia gravis, while central AChE inhibitors are crucial in the treatment of neurodegenerative diseases, including AD. CPP’s significant in vitro inhibition of AChE suggests its potential as a peripheral or central AChE inhibitor for treating neurodegenerative diseases, including myasthenia gravis and AD.
UHPLC-HRMS analysis
A total of 47 compounds were identified in CPP, and the identification results are presented in Supporting Information Table S4, with the TIC spectrum shown in Figure 4. These compounds were classified into seven groups based on their structural features: 2 flavonoids (compounds 1 and 2), 7 phenolic compounds (compounds 3–9), 1 alkaloid (compound 10), 10 amino acids and their derivatives (compounds 11–20), 8 fatty acid derivatives (compounds 20–28), 2 nucleosides (compounds 29 and 30), and 17 compounds of other structural types (compounds 31–47). The phenolic compounds identified included ferulic acid, chlorogenic acid, neochlorogenic acid, 2,5-ditert-butylbenzene-1,4-diol, 2,5-dihydroxybenzaldehyde, 4-hydroxybenzaldehyde, and 3,5-ditert-butyl-4-hydroxybenzaldehyde. Notably, compounds 6–47 have not been reported previously in studies on P. caimito, further expanding the chemical database of secondary metabolites in this plant and providing a vital chemical foundation for elucidating its bioactive material properties.
Figure 4. UHPLC-HRMS profiles of purified CPP.
Network Pharmacology Analysis
Network pharmacology, as a system’s biology tool, can predict the potential mechanisms of action by analyzing drug–target interactions (Ou et al., 2021). Since the pathogenesis of AD is closely linked to free radical accumulation and AChE activity, and given that previous in vitro experiments confirmed the free radical scavenging ability and AChE inhibitory activity of purified CPP, it suggests potential therapeutic efficacy for AD. This study employed a network pharmacology approach to investigate the possible mechanisms of key compounds in CPP for treating AD.
The potential targets of purified CPP were predicted using the Swiss Target Prediction database, yielding 87 targets (p > 0.5). Additionally, 14,420 targets related to AD were screened from a disease-related database. By analyzing the intersection of these two target sets, 75 potential targets related to CPP for AD were identified (Figure 5A), laying the foundation for subsequent network analyses.
Figure 5. (A) Target overlap: Venn diagram illustrating the shared targets between ADe-related compounds (ferulic acid, isorhamnetin, and quercetin) and their associated targets. (B) PPI network: protein–protein interaction network of overlapping targets between compounds and AD. Nodes (circles) represent protein targets. Node size/color indicates interaction strength (larger and darker green nodes represent stronger interactions). (C) Pathway enrichment: significantly enriched KEGG pathways (-log10(P) values) for core Alzheimer’s disease targets. The color gradient reflects enrichment significance (light to dark orange: low to high -log10(P)). (D) Functional enrichment: gene ontology terms (-log10(P) values) for biological processes related to AD. The color gradient represents statistical significance (light to dark orange: low to high -log10(P)). KEGG: Kyoto Encyclopedia of Genes and Genomes.
A PPI network was then constructed based on these targets using the STRING database and Cytoscape 3.9.1 software, comprising 75 core targets (Figure 5B). The PPI network contained 73 nodes and 341 edges, with an average node degree of 18.68, suggesting that CPP could exert therapeutic effects on AD through multiple targets and pathways. Among the network’s key nodes, v-Akt murine thymoma viral oncogene homolog 1 (AKT1), proto-oncogene tyrosine-protein kinase Src (SRC), and epidermal growth factor receptor (EGFR) had the highest degree of connectivity, with AKT1 emerging as the most important node. Its high connectivity degree highlights its critical role in signaling within the network.
In order to further elucidate the mechanism of action of CPP, 73 core targets from the PPI network, derived from compounds such as ferulic acid, isorhamnetin, and quercetin, were subjected to GO and KEGG enrichment analyses using the Metascape platform. The top 20 biological processes and pathways were identified and analyzed. As depicted in Figure 5C, ‘nitrogen metabolism’ and ‘cellular response to nitrogen compounds’ emerged as the processes with the highest number of targets, suggesting that nitrogen metabolism may be crucial for understanding the mechanism of action of the compounds studied. Additionally, the ‘cholinergic synapse’ pathway, known for its central role in AD progression, caught our attention. This aligns with the enrichment of the ‘chemical synaptic transmission’ process in the GO biological analysis. The ‘cholinergic synapse’ pathway directly involves AChE, a key target. PPI network analysis revealed that AChE, with a degree of connectivity of 20, exceeded the average network connectivity of 18.68, indicating that AChE interacts with multiple targets within the network and plays a significant role in biological systems. This observation is consistent with our in vitro findings, showing that CPP inhibits AChE activity. Consequently, our analysis reinforces the hypothesis that CPP may offer therapeutic potential for AD through AChE inhibition. This provides new insights and a scientific rationale for considering CPP in AD treatment strategies.
Molecular Docking
As shown in Table 7 and Figure 6, the docking scores (DS) for ferulic acid, isorhamnetin, and quercetin with AChE were -5.9028, -6.7583, and -6.9485, respectively, all exhibiting greater absolute values than the control compound, tacrine (DS = -5.6660). In molecular docking studies, a higher absolute value of DS signifies a stronger binding affinity between the compound and the target protein as well as a more stable binding in vivo (Zhang et al., 2023). These results suggest that the binding affinities of three key compounds for AChE are superior to that of tacrine, likely due to the formation of additional interaction sites and forces between the compounds and the protein.
Table 7. The molecular docking results of compounds with AChE.
| Entry | Compound | Amino acid residues | Critical interaction force | DS |
|---|---|---|---|---|
| 1. | Donepezil | PHE295; TYR337; TRP286; and TRP86 | Hydrogen bond with PHE295; π-H interaction with TYR337 and TRP268; π-π interaction with TRP286 and TRP86 | –8.6228 |
| 2. | Tacrine | TYR86 | π-H interaction with TRP86 | –5.6660 |
| 3. | Ferulic acid | GLN71, VAL73 | Hydrogen bond with GLN71 and VAL73 | –5.9028 |
| 4. | Isorhamnetin | TYR341, TRP86 | π-H interaction with TRP86; π-π interaction with TYR341 | –6.7583 |
| 5. | Quercetin | TYR26, TYR341 | π-H interaction with TYR341 and TYR86 | –6.9485 |
Note: DS: MOE 2015 docking score, a larger absolute value indicates a stronger binding force.
Figure 6. Molecular docking configurations of the following compounds with AChE: (A) Donepezil; (B) tacrine; (C) ferulic acid; (D) isorhamnetin; and (E) quercetin.
Further analysis of the interaction modes between these five compounds and the target revealed that ferulic acid forms hydrogen bonds with the amino acid residues GLN71 and VAL73 of AChE. Quercetin engages in π-H interactions with the residues TYR26 and TYR341 of AChE. Isorhamnetin forms both π-H and π-π interactions with the residues TYR341 and TRP86 of AChE. These interaction patterns indicate that the three key compounds enhance their binding affinity by establishing multiple non-covalent interactions with critical amino acid residues of AChE. In contrast, tacrine forms only a single π-H interaction with the residue TRP86. Additionally, donepezil interacts with four amino acid residues of AChE through multiple interaction forces, demonstrating better binding affinity than other four ligands.
In summary, this study elucidates the binding affinities of ferulic acid, isorhamnetin, and quercetin with AChE through molecular docking experiments and compares these compounds with known AChE inhibitors. The docking results further confirm the inhibitory activities of these three key compounds against AChE, supporting the reliability of the predictions made by network pharmacology in this study.
Conclusions
This study investigates the antioxidant pretreatment of CPP through PPO inactivation through blanching at 100°C for 3 min, coupled with the addition of 1% Na2SO3 at 1:1 (g/mL) ratio. This treatment enhanced the extraction yield of chlorogenic polyphenols (CPP) from 4.022±0.02 mg/g to 10.40±0.20 mg/g. The optimal ultrasonic extraction parameters for CPP were established through single-factor experiments and BBD response surface methodology, achieving an extraction yield of 17.08±0.39 mg/g. Following the purification with AB-8 resin, the CPP purity reached 30%. This work outlines an efficient protocol for polyphenol extraction from plants, particularly those rich in PPO, contributing to improved polyphenol stability and potential identification of novel chemical structures. The ultrasonic extraction method demonstrates both high efficiency and environmental compatibility, offering a significant foundation for the commercial exploitation of CPP-derived polyphenols.
Purified CPP displayed notable antioxidant activity, with the IC50 values of 0.0046±0.40% mg/mL for DPPH (Vc, IC50 DPPH = 0.0200±0.44% mg/mL) and 0.7400±2.90% mg/mL for ABTS (Vc, IC50 ABTS = 0.2224±0.86% mg/mL). Additionally, CPP exhibited potent inhibitory effects on AChE (IC50 AChE = 1.1160±0.76% mg/mL) and TYR (IC50 TYR = 0.3997±0.56% mg/mL). These results suggest that P. caimito represents a promising source of antioxidant phenolic compounds for the food industry, serving as a natural preservative to enhance product stability and shelf life. In cosmetics, these compounds may be incorporated into formulations as antioxidants and TYR inhibitors, offering anti-aging or skin-whitening benefits. In pharmaceuticals, they present potential for the development of therapies addressing oxidative stress, pigmentation disorders, and neurodegenerative diseases. Of particular interest is the therapeutic potential of CPP in AD, attributed to its free radical scavenging and AChE inhibitory activities.
The UHPLC-HRMS analysis identified 47 compounds in the purified CPP, further refining the phytochemical profile of P. caimito and offering a valuable resource for drug development. Among these, ferulic acid, isorhamnetin, and quercetin were pinpointed as key functional molecules that modulate AChE, as confirmed by network pharmacology analysis. Molecular docking studies revealed that these three compounds exhibited superior binding affinities to AChE, compared to the positive control, tacrine, supporting their AChE inhibitory activity and aligning with previous reports (Ren et al., 2024; Tkacz et al., 2020). Based on these key molecules and the AChE target, network pharmacology suggests that the potential molecular mechanism of CPP in AD involves targeting AChE, with therapeutic effects mediated through the cholinergic synaptic pathway. These findings open promising avenues for further exploration of CPP’s anti-AD mechanisms. The identification of key molecules and the observed activities provide novel insights and a solid theoretical foundation for the development of multi-component drugs.
Competing Interests
The authors had no relevant financial or nonfinancial interests to disclose.
Author Contributions
All authors contributed equally to this article.
Conflicts of Interest
The authors declare no conflict of interest, financial or otherwise.
Funding
2024 Innovation Training Program for college students of Jiangsu Ocean Universityt [2024-492].
REFERENCES
Abreu, M., De, N.P., Sales, P., De, O.F., and Nascimento, A. 2019. Antimicrobial and antidiarrheal activities of methanolic fruit peel extract of Pouteria caimito. Pharmacog J. 11(5):944–950. 10.5530/pj.2019.11.150
Aghdam, M.S., Luo, Z., Li, L., Jannatizadeh, A., Fard, J.R., and Pirzad, F. 2020. Melatonin treatment maintains the nutraceutical properties of pomegranate fruits during cold storage. Food Chem. 303:125385. 10.1016/j.foodchem.2019.125385
Ajala, A., Uzairu, A., Shallangwa, G.A., and Abechi, S.E. 2022. Structure-based drug design of novel piperazine containing hydrazone derivatives as potent Alzheimer inhibitors: molecular docking and drug kinetics evaluation. Brain Disord. 7:100041. 10.1016/j.dscb.2022.100041
Arif, A.B., Susanto, S., Matra, D.D., and Widayanti, S.M. 2022. Identification of volatile compounds in several parts of Abiu (Pouteria Caimito). IOP Conf Ser Earth Environ Sci. 1024(1):12066. 10.1088/1755-1315/1024/1/012066
Benito-Román, Ó., Sanz, M.T., Melgosa, R., Paz, E.D., Escudero, I., and Beltran, S. 2019. Studies of polyphenol oxidase inactivation by means of high pressure carbon dioxide (HPCD). J Supercrit Fluids. 147:310–321. 10.1016/j.supflu.2018.07.026
Carcelli, M., Rogolino, D., Bartoli, J., Pala, N., Compari, C., Ronda, N., Bacciottini, F., Incerti, M., and Fisicaro, E. 2020. Hydroxyphenyl thiosemicarbazones as inhibitors of mushroom tyrosinase and antibrowning agents. Food Chem. 303:125310. 10.1016/j.foodchem.2019.125310
Castro-Godoy, W.D., Schmidt, L.C., and Argüello, J.E. 2019. A green alternative for the conversion of arylboronic acids/esters into phenols promoted by a reducing agent, sodium sulfite. Eur J Org Chem. 2019(19):3035–3039. 10.1002/ejoc.201900311
Chai, W., Pan, Q.X., Bai, Q.H., Wu, Y.F., Wei, W.S., Wang, L.J., and Zhu, D. 2023. Condensed tannins from the leave of Dimocarpus longan Lour. exhibit anti-tyrosinase, anti-melanogenesis, anti-browning, anti-α-glucosidase, and anti-glycation activities. Ind Crops Prod. 206:117605. 10.1016/j.indcrop.2023.117605
Chaudhary, S.K., Keithellakpam, O.S., Lalvenhimi, S., Chanda, J., Bhowmick, S., Kar, A., Nameirakpam, B., Bhardwaj, P.K., Sharma, N., Rajashekar, Y., Devi, S.I., and Mukherjee, P.K. 2023. Chemo diversity of ginger—a potent crop in Manipur and its acetylcholinesterase (AChE) inhibitory potential. Biochem Syst Ecol. 106:104560. 10.1016/j.bse.2022.104560
Cho, Y.K., and Ahn, H.Y.E.K. 1999. Purification and characterization of polyphenol oxidase from potato: II. inhibition and catalytic mechanism. J Food Biochem. 23(6):593–605. 10.1111/j.1745-4514.1999.tb00587.x
Coronel, R.E., Sotto, R.C., Dela Cruz, F.S., Jr., and Banasihan, I.G. 1998. Note: introduction, evaluation and propagation of Abiu (Pouteria caimito [Ruiz and Favan] Radlk.). Philipp Agric Sci. 81(3–4):168–175. Journal Article. 3442. https://www.ukdr.uplb.edu.ph/journal-articles/3442
Daina, A., Michielin, O., and Zoete, V. 2019. Swiss target prediction: updated data and new features for efficient prediction of protein targets of small molecules. Nucleic Acids Res. 47(W1):W357–W364. 10.1093/nar/gkz382
Di Trana, A., Brunetti, P., Giorgetti, R., Marinelli, E., Zaami, S., Busardò, F.P., and Carlier, J. 2021. In silico prediction, LC-HRMS/MS analysis, and targeted/untargeted data-mining workflow for the profiling of phenylfentanyl in vitro metabolites [J]. Talanta. 235:122740. 10.1016/j.talanta.2021.122740
Falguera, V., Pagán, J., Garza, S., Garvín, A., and Ibarz, A. 2012. Inactivation of polyphenol oxidase by ultraviolet irradiation: protective effect of melanins. J Food Eng. 110(2):305–309. 10.1016/j.jfoodeng.2011.04.005
Fazil, M.M., Gul, A., and Jawed, H. 2024. Optimization of silver nanoparticles synthesis via Plackett–Burman experimental design: in vitro assessment of their efficacy against oxidative stress-induced disorders. RSC Adv. 14(29):20809–20823. 10.1039/D4RA02774D
Gfeller, D., Grosdidier, A., Wirth, M., Daina, A., Michielin, O., and Zoete, V. 2014. Swiss target prediction: a web server for target prediction of bioactive small molecules. Nucleic Acids Res. 42:W32–W38. 10.1093/nar/gku293
Guo, L., Tan, D.C., Bao, R.J., Sun, Q., Xiao, K.M., Xu, Y., Wang, J.M and Hua, Y. 2020. Purification and antioxidant activities of polyphenols from Boletus edulis Bull Fr J Food Meas Char. 14:649–657. 10.1007/s11694-019-00311-4
Han, Y., Ma, Z., Wang, X., Sheng, Y.Y., and Liu, Y. 2023. Demethylation of ethanol organosolv lignin by Na2SO3 for enhancing antioxidant performance. Sustain Chem Pharm. 36:101312. 10.1016/j.scp.2023.101312
Leung, W.T.W., and Flores, M. 1961. Food Composition Table for Use in Latin America. US Government Printing Office, Washington, DC.
Leyva, A., Quintana, A., Sánchez, M., Rodríguez, E.N., Cremata, J., and Sánchez, J.C. 2008. Rapid and sensitive anthrone–sulfuric acid evaluation in microplate format to quantify carbohydrate in biopharmaceutical products: method development and validation. Biologicals 36(2):134–141. 10.1016/j.biologicals.2007.09.001
Liang, W., Wang, X., Zhang, L., Jiao, S.Y., Song, H., Sun, J.R., and Wang, D.H. 2024. Changes and biotransformation mechanism of main functional compounds during Kombucha fermentation by the pure cultured tea fungus. Food Chem. 458:140242. 10.1016/j.foodchem.2024.140242
Lim, T.K. 2013. Pouteria caimito. In: Lim, T.K. (Ed.) Edible Medicinal and Non-Medicinal Plants, Vol. 6, Fruits. Springer, Dordrecht, the Netherlands, Chap. 6, pp. 129–132. 10.1007/978-94-007-5628-1_22
Lin, L.Z., Lei, F.F., Sun, D.W., Dong, Y., Yang, B., and Zhao, M. 2012. Thermal inactivation kinetics of Rabdosia serra (Maxim.) Hara leaf peroxidase and polyphenol oxidase and comparative evaluation of drying methods on leaf phenolic profile and bioactivities. Food Chem. 134(4):2021–2029. 10.1016/j.foodchem.2012.04.008
Liu, S.B., Qiao, L.P., He, H.L., Zhang, Q., Chen, X.L., Zhou, W.Z., and Zhang, Y.Z. 2011. Optimization of fermentation conditions and rheological properties of exopolysaccharide produced by deep-sea bacterium Zunongwangia profunda SM-A87. Plos One. 6(11):e26825. 10.1371/journal.pone.0026825
Logesh, R., Prasad, S.R., Chipurupalli, S., Robinson, N., and Mohankumar, S.K. 2023. Natural tyrosinase enzyme inhibitors: a path from melanin to melanoma and its reported pharmacological activities. Biochimica et Biophysica Acta Rev Cancer. 1878(6):188968. 10.1016/j.bbcan.2023.188968
Lu, D., Rege, B., Raw, A., Yang, J.Y., Alam, K., Bode, C., Zhao, L., Faustino, P., Wu, F., Shakleya, D., Nickum, E., Li, B.V., Wang, R., Stier, E., Miezeiewski, B., Patel, R., Boam, A., Lionberger, R., Keire, D., and Yu, L. 2024. Antioxidants had no effects on the in vitro permeability of BCS III model drug substances. J Pharm Sci. 13(9):2708–2714. 10.1016/j.xphs.2024.05.033
Marucci, G., Buccioni, M., Dal Ben, D., Lambertucci, C., Volpini, R., and Amenta, F. 2021. Efficacy of acetylcholinesterase inhibitors in Alzheimer’s disease. Neuropharmacology. 190:108352. 10.1016/j.neuropharm.2020.108352
Naseem, Z., Zahid, M., Hanif, M.A., Shahid, M. 2021. Green extraction of ethnomedicinal compounds from Cymbopogon citratus Stapf using the hydrogen-bonded supramolecular network. Sep Sci Technol. 56(9):1520–1533. 10.1080/01496395.2020.1781894
Omar, K.A., and Sadeghi, R. 2022. New chloroacetic acid-based deep eutectic solvents for solubilizing metal oxides. J Mol Liq. 347:118393. 10.1016/j.molliq.2021.118393
Ou, H.Y., Ye, X.P., and Liu, J.H. 2019. Study on the mechanism of peptic colitis in the treatment of ulcerative colitis based on network pharmacology. Chin J Tradit Chin Med. 5:2438–2443.
Pandey, A., Belwal, T., Sekar, K.C., D. Bhatt, I., and S. Rawal, R. 2018. Optimization of ultrasonic-assisted extraction (UAE) of phenolics and antioxidant compounds from rhizomes of Rheum moorcroftianum using response surface methodology (RSM). Ind Crops Prod. 119:218–225. 10.1016/j.indcrop.2018.04.019
Pant, S., Kumar, K.R., Rana, P., Anthwal, T., Ali, M.S., Gupta, M., Chauhan, M., and Nain, S. 2024. Novel substituted pyrimidine derivatives as potential anti-Alzheimer’s agents: synthesis, biological, and molecular docking studies. ACS Chem Neurosci. 15(4):783–797. 10.1021/acschemneuro.3c00662
Qin, Z., Chang, Y.L., Yang, Z.C., Fan, W., Chen, Z.M., Gu, L.B., Qin, Z., Liu, H.M., Zhu, X.L., and Ma, Y.X. 2025. Microwaving plus enzymatic pretreatment of safflower seeds increases the phenolic content and oxidative stability of extracted oil. Food Chem. 464:141831. 10.1016/j.foodchem.2024.141831
Ren, T., Chen, Z., Xie, J., Tan, S.M., and Zhu, Y-P. 2024. Studies on the role of Rosa roxburghii Tratt quercetin in improving intestinal metabolism and the microbiome in mice with Alzheimer’s disease. J Funct Foods. 114:106046. 10.1016/j.jff.2024.106046
Rumpf, J., Burger, R., and Schulze, M. 2023. Statistical evaluation of DPPH, ABTS, FRAP, and Folin–Ciocalteu assays to assess the antioxidant capacity of lignins. Int J Biol Macromol. 233:123470. 10.1016/j.ijbiomac.2023.123470
Silva, C.A.M. 2007. Contribuição ao Estudo Químico e Biológico de POUTERIA GARDNERII (Mart. & Miq.) Baehni (Sapotaceae). MSc thesis, Universidade Federal de Minas Gerais, Belo Horizonte, Brazil.
Sukhonthara, S., and Theerakulkait, C. 2012. Inhibitory effect of rice bran extract on polyphenol oxidase of potato and banana. Int J Food Sci Technol. 47(3):482–487. 10.1111/j.1365-2621.2011.02867.x
Tuesta, G., Orbe, P., Merino-Zegarra, C., Rengifo-Salgado, E.L., and Cabanillas, B. 2014. Actividad antioxidante y determinación de compuestos fenólicos del caimito (Pouteria caimito), caimitillo (Chrsophylum sanguinolentum), guava (Inga edulis) y yarina (Phytelephas macrocarpa). Folia Amazónica. 23(1):87–92. 10.24841/fa.v23i1.11
Terefe, N.S., Delon, A., Buckow, R., and Versteeg, C. 2015. Blueberry total phenol oxidase: characterization and the kinetics of thermal and high-pressure activation and inactivation. Food Chem. 188:193–200. 10.1016/j.foodchem.2015.04.040
Tkacz, K., Wojdyło, A., Turkiewicz, I.P., Ferreres, F., Moreno, D.A., and Nowicka, P. 2020. UPLC-PDA-Q/TOF-MS profiling of phenolic and carotenoid compounds and their influence on anticholinergic potential for AChE and BuChE inhibition and on-line antioxidant activity of selected Hippophaë rhamnoides L. cultivars. Food Chem. 309:125766. 10.1016/j.foodchem.2019.125766
Ünal, M.Ü. 2007. Properties of polyphenol oxidase from Anamur banana (Musa cavendishii). Food Chem. 100(3):909–913. 10.1016/j.foodchem.2005.10.048
Wang, G.C., He, M., Huang, Y., and Peng, Z.Y. 2023. Synthesis and biological evaluation of new kojic acid-1,3,4-oxadiazole hybrids as tyrosinase inhibitors and their application in the anti-browning of fresh-cut mushrooms. Food Chem. 409:135275. 10.1016/j.foodchem.2022.135275
Wang, W., Pan, Y.A., Zhao, J.J., Wang, Y.H., Yao, Q.P., and Li, S-S. 2024. Development and optimization of green extraction of total phenols in Michelia alba using natural deep eutectic solvents (NADES) and evaluation of bioactivity. Sustain Chem Pharm. 37:101425. 10.1016/j.scp.2023.101425
Wang, Z., Sun, H-Y., Shen, C., Hu, X.P., Gao, J.B., Li, D., Cao, D.S., and Hou, T.J. 2020. Combined strategies in structure-based virtual screening. Phys Chem Chem Phys. 22(6):3149–3159. 10.1039/C9CP06303J
Wu, L., Song, W., Jiang, Y., Dai, Y., Qin, Z.Y., Liu, L.L., Wei, S.D., and Chen, H. 2025. Structural characterization of complex tannins from Euryale ferox fruit peels and their inhibitory mechanisms against tyrosinase activity and melanogenesis. Int J Biol Macromol. 298:139909. 10.1016/j.ijbiomac.2025.139909
Wuyts, N., De Waele, D., and Swennen, R. 2006. Extraction and partial characterization of polyphenol oxidase from banana (Musa acuminata Grande Maine) roots. Plant Physiol Biochem. 44(5–6):308–314. 10.1016/j.plaphy.2006.06.005
Xue, C.X., and Yang, Z.Y. 2015. Landscape Plants: A Pictorial Guide: 680 Ornamental Trees, 2nd edn. Guangdong Science and Technology Press, Guangzhou, China.
Zhang, X., Lian, S., Zhang, Y., and Zhao, Q.C. 2022. Efficacy and safety of donepezil for mild cognitive impairment: a systematic review and meta-analysis. Clin Neurol Neurosurg. 213:107134. 10.1016/j.clineuro.2022.107134
Zhang, M., Zhang, X., Pei, J., Guo, B.L., Zhang, G.S., Li, M.H., and Huang, L.F. 2023. Identification of phytochemical compounds of Fagopyrum dibotrys and their targets by metabolomics, network pharmacology and molecular docking studies. Heliyon. 9(3):e15496. 10.1016/j.heliyon.2023.e14029
Zhao, H.Y., Zhu, H.Y., Tang, Q., Lin, Q., Hao, Y.K., Ou, H.L., Wu, T.Y., Xuan, W.S., Zhang, H.P., Qin, B.F., Zhang, Y.B., Wang, J.H., and Wang, G.C. 2024. Anti-inflammatory and antiviral activities of compounds from the fruit of Pouteria caimito. Cogent Food Agric. 10(1):2298023. 10.1080/23311932.2023.2298023
Zhou, D., Li, L., Wu, Y.W., Fan, J.F., and Ouyang, J. 2015. Salicylic acid inhibits the enzymatic browning of fresh-cut Chinese chestnut (Castanea mollissima) by competitively inhibiting total phenol oxidase. Food Chem. 171:19–25. 10.1016/j.foodchem.2014.08.115
Supplementary
Table S1. Design and results of Plackett Burman experiment.
| Run | Factor | TPC (mg/g) | ||||
|---|---|---|---|---|---|---|
| A | B | C | D | E | ||
| 1 | –1 | –1 | –1 | 1 | –1 | 2.202±0.06 |
| 2 | 1 | 1 | 1 | –1 | –1 | 2.069±0.03 |
| 3 | –1 | –1 | 1 | –1 | 1 | 2.159±0.02 |
| 4 | –1 | –1 | –1 | –1 | –1 | 1.816±0.05 |
| 5 | 1 | 1 | –1 | –1 | –1 | 2.518±0.13 |
| 6 | –1 | 1 | 1 | –1 | 1 | 7.528±0.08 |
| 7 | 1 | 1 | –1 | 1 | 1 | 9.945±0.09 |
| 8 | 1 | –1 | 1 | 1 | 1 | 5.282±0.24 |
| 9 | –1 | 1 | 1 | 1 | –1 | 4.261±0.09 |
| 10 | 1 | –1 | –1 | –1 | 1 | 3.286±0.09 |
| 11 | 1 | –1 | 1 | 1 | –1 | 1.948±0.06 |
| 12 | –1 | 1 | –1 | 1 | 1 | 9.396±0.28 |
Note: The experimental factors were assigned coded levels as follows: A (Ultrasonic duration): -1=30 min, +1=70 min; B (Ultrasonic temperature): -1=20°C, +1=40°C; C (Liquid-to-Solid ratio): -1=10 mL/g, +1=50 mL/g; D (Ethanol concentration): -1=5%, +1=35%; E (Extraction times): -1=2, +1=4.
Table S2. Analysis of variance for regression model equation.
| Source | Sum of Squares | Df | Mean Square | F-value | p-value | Saliency |
|---|---|---|---|---|---|---|
| Model | 92.31 | 5 | 18.46 | 16.49 | 0.0019 | ** |
| A | 0.4460 | 1 | 0.4460 | 0.3984 | 0.5512 | |
| B | 30.16 | 1 | 30.16 | 26.94 | 0.0020 | ** |
| C | 2.910 | 1 | 2.910 | 2.600 | 0.1578 | |
| D | 15.54 | 1 | 15.54 | 13.88 | 0.0098 | ** |
| E | 43.25 | 1 | 43.25 | 38.63 | 0.0008 | *** |
| Residual | 6.720 | 6 | 1.12 | / | / | / |
| Cor Total | 99.03 | 11 | / | / | / | / |
| R2 | 0.9322 | / | / | / | / | |
| R2adj | 0.8756 | / | / | / | / | / |
| R2predicted | 0.7287 | / | / | / | / |
Note: Significance levels: P > 0.05 (no significant difference), **P < 0.01 (very significant difference), ***P < 0.001 (highly significant difference). Model evaluation: R2 (coefficient of determination, which quantifies explained variance; values approaching 1 signify improved predictive performance), R2adj (adjusted R2, which accounts for model complexity; values nearing 1 suggest robustness against overfitting), and R2 predicted (Predicted Coefficient of Determination, where a value of ≥ 0.7 is considered to demonstrate good predictive power).
Table S3. Design and results of Steepest ascent experimental.
| Run | Step length | A (°C) | B (%) | C (times) | TPC (mg/g) |
|---|---|---|---|---|---|
| 1 | 0 | 20 | 5 | 1 | 4.990±0.14 |
| 2 | 0+1Δ | 24 | 9.5 | 2 | 7.747±0.38 |
| 3 | 0+2Δ | 28 | 14 | 3 | 9.736±0.20 |
| 4 | 0+3Δ | 32 | 18.5 | 4 | 7.580±0.15 |
| 5 | 0+4Δ | 36 | 23 | 5 | 7.502±0.05 |
Note: Δ: Steps of change in experimental factor levels; A: Ultrasonic temperature; B: EtOH concentration; C: Extraction times.
Table S4. Retention time and MS/MS fragmentation pattern for proposed compound 1 to 47 from CPP purified.
| Number | Compound | Molecular formula | Actual measured m/z | Theoretical m/z | RT [min] | Classification |
|---|---|---|---|---|---|---|
| 1 | Quercetin | C15H10O7 | 303.04993 | 302.04265 | 8.033 | Flavonoids |
| 2 | Isorhamnetin | C16H12O7 | 317.06564 | 316.0583 | 9.089 | |
| 3 | Ferulic acid | C10 H10O4 | 193.05046 | 194.05791 | 8.553 | Phenolic |
| 4 | Chlorogenic acid | C16 H18O9 | 353.08627 | 354.09508 | 5.179 | |
| 5 | Neochlorogenic acid | C16H18 O9 | 353.08615 | 354.09508 | 3.147 | |
| 6 | 2,5-ditert-butylbenzene-1,4-diol | C14H22 O2 | 221.15459 | 222.16198 | 20.301 | |
| 7 | 2,5-Dihydroxybenzaldehyde | C7H6O3 | 137.02432 | 138.03169 | 4.1 | |
| 8 | 4-Hydroxybenzaldehyde | C7H6O2 | 121.02946 | 122.03678 | 5.868 | |
| 9 | 3,5-divert-butyl-4-hydroxybenzaldehyde | C15H22O2 | 235.16927 | 234.16198 | 26.421 | |
| 10 | 2,4,5-trimethylamine | C9H13N | 136.11208 | 135.1048 | 48.485 | Alkaloids |
| 11 | N-Acetyl-L-leucine | C8H15NO3 | 172.0979 | 173.10519 | 6.937 | Amino Acids and Derivatives |
| 12 | N-Acetyl-L-tyrosine | C11H13NO4 | 222.07707 | 223.08446 | 3.954 | |
| 13 | DL-Tryptophan | C11H12N2O2 | 203.08252 | 204.08988 | 8.853 | |
| 14 | D- (+)-Tryptophan | C11H12N2O2 | 203.08255 | 204.08988 | 3.247 | |
| 15 | Isoleucine | C6H13NO2 | 132.10184 | 131.09463 | 1.352 | |
| 16 | L-Phenylalanine | C9H11NO2 | 164.07162 | 165.07898 | 1.875 | |
| 17 | Glycyl-L-leucine | C8H16N2O3 | 189.12329 | 188.11609 | 1.561 | |
| 18 | 2-acetamido-3-(1 H-indol-3-yl) propanoic acid | C13H14N2O3 | 245.09311 | 246.10044 | 8.863 | |
| 19 | D- (+)-Pyroglutamic acid | C5H7NO3 | 130.04979 | 129.04259 | 1.225 | |
| 20 | 1-Aminocyclohexanecarboxylic acid | C7H13NO2 | 144.10184 | 143.09463 | 1.012 | |
| 21 | Hexadecanamide | C16H33NO | 256.26349 | 255.25621 | 21.187 | Fatty Acids and Derivatives |
| 22 | (Z)-9,12,13-trihydroxyoctadec-15-enoic acid | C18H34O5 | 329.23322 | 330.24062 | 16.751 | |
| 23 | octadecanamide | C18H37NO | 284.29471 | 283.28751 | 38.566 | |
| 24 | Azelaic acid | C9H16O4 | 187.09752 | 188.10486 | 10.747 | |
| 25 | Dimorphecolic acid | C18H32O3 | 279.23184 | 296.23514 | 29.128 | |
| 26 | Dodecanedioic acid | C12H22O4 | 229.14436 | 230.15181 | 17.061 | |
| 27 | 1-Stearoylglycerol | C21H42O4 | 341.30505 | 358.30831 | 39.349 | |
| 28 | Myristyl sulfate | C14H30O4S | 293.17932 | 293.17921 | 27.223 | |
| 29 | Guanine | C5H5N5O | 152.05658 | 151.04941 | 1.249 | Nucleotides and Derivatives |
| 30 | Adenosine | C10H13N5O4 | 268.10376 | 267.09675 | 1.251 | |
| 31 | α,α-Trehalose | C12H22O11 | 377.08408 | 342.297 | 0.945 | Other Natural Products |
| 32 | 2,3-dihydro-1-benzofuran-2-carboxylic acid | C9 H8O3 | 163.04001 | 164.04734 | 5.606 | |
| 33 | Bis (4-ethyl benzylidene) sorbitol | C24H30O6 | 415.2114 | 414.20424 | 22.603 | |
| 34 | trans-3-Indoleacrylic acid | C11H9NO2 | 188.07045 | 187.06333 | 3.247 | |
| 35 | Nicotinic acid | C6H5NO2 | 124.03925 | 123.03203 | 1.053 | |
| 36 | DEET | C12H17NO | 192.13818 | 191.13101 | 16.786 | |
| 37 | Benzoic acid | C7H6O2 | 121.0282 | 122.03678 | 9.954 | |
| 38 | Phenylacetaldehyde | C8H8O | 119.05016 | 120.05751 | 7.452 | |
| 39 | Bis (2-ethylhexyl) adipate | C22H42O4 | 393.29767 | 370.30831 | 41.633 | |
| 40 | Di(2-ethylhexyl) phthalate | C24 H38O4 | 391.28436 | 390.27701 | 41.554 | |
| 41 | Dibutyl phthalate | C16H22O4 | 279.15906 | 278.15181 | 29.008 | |
| 42 | Octyl hydrogen phthalate | C16H22O4 | 279.15912 | 278.15181 | 28.804 | |
| 43 | Monobutyl phthalate | C12H14O4 | 221.08183 | 221.08193 | 17.127 | |
| 44 | N, N-Dimethylaniline | C8 H11N | 122.09643 | 121.08915 | 48.483 | |
| 45 | N, N-Dimethyldecylamine N-oxide | C11H13NO4 | 222.07707 | 223.08446 | 3.954 | |
| 46 | Corchorifatty acid F | C18H32O5 | 327.21756 | 328.22491 | 15.518 | |
| 47 | 2-hydroxy butane dioic acid | C4H6O5 | 133.01411 | 134.02152 | 1.015 |