
Download
ORIGINAL ARTICLE
Effects of rice-to-water ratio and cooking method on the starch digestibility and estimated glycemic index of low-amylose brown rice
Anuchita Moongngarm1, Natcha Jorralee2, Patiwit Loypimai3*
1Department of Food Technology and Nutrition, Faculty of Technology, Mahasarakham University, Maha Sarakham, Thailand;
2Department of Nutrition, Nakhonphanom Hospital, Nakhonphanom, Thailand;
3Department of Nutrition and Dietetics, Faculty of Allied Health Sciences, Bansomdejchaopraya Rajabhat University, Bangkok, Thailand
Abstract
Brown rice is valued for its nutritional benefits but often perceived as less palatable due to its firm texture and longer cooking time. Cooking conditions can modify starch structure and influence glycemic response by -altering starch digestibility (SD). This study examined how different rice-to-water ratios and cooking methods affect the chemical composition, degree of gelatinization (DG), SD, resistant starch (RS), and estimated glycemic index (eGI) of low-amylose brown rice. A 1:2 rice-to-water ratio cooked in an electric cooker significantly reduced DG, SD, and eGI compared with higher water ratios, which yielded softer, fully cooked grains. This ratio received slightly lower sensory scores than the 1:3 sample but was still rated higher than the 1:4 ratio. Among the cooking techniques evaluated, steaming consistently produced brown rice with lower DG, SD, and eGI without adversely affecting macronutrient composition. Microstructural observations and texture profiling supported these findings, showing more compact granule structures and firmer textures in steamed and microwave-cooked samples. Optimizing the water level (1:3 rice-to-water ratio) and using steaming can reduce the glycemic potential of low-amylose brown rice while preserving desirable texture, providing practical guidance for health-focused rice products. Future studies should validate these findings through in vivo trials, as current eGI values are based on in vitro measurements, to ensure accurate dietary recommendations.
Key words: Brown rice, Degree of gelatinization, Glycemic index, Starch digestibility
*Corresponding Author: Patiwit Loypimai, Department of Nutrition and Dietetics, Faculty of Allied Health Sciences, Bansomdejchaopraya Rajabhat University, Bangkok 10600, Thailand. Emails : patiwit.loypimai@gmail.com; scpatiwit@bsru.ac.th
Academic Editor: Prof. Massimiliano Rinaldi, University of Parma, Italy
Received: 16 September 2025; Accepted: 26 May 2026; Published: 17 June 2026
© 2026 Codon Publications
This is an Open Access article distributed under the terms of the Creative Commons Attribution-NonCommercial-ShareAlike 4.0 International (CC BY-NC-SA 4.0). License (http://creativecommons.org/licenses/by-nc-sa/4.0/)
Introduction
Rice (Oryza sativa L.) is one of the most widely -consumed grains, particularly in Asia, with global -consumption reaching 490.27 million metric tons in 2019 (Shahbandeh, 2019). Rice is typically consumed as intact kernels, including polished rice and brown rice. Brown rice is a whole grain that retains the bran layer (6–7% of the kernel), embryo (2–3%), and endosperm (approximately 90%) (Ershidat et al., 2024). Whole-grain diets are increasingly promoted due to their fiber, bioactive compounds, and nutrients, which are associated with reduced risks of chronic diseases such as cardiovascular disease and type 2 diabetes (Deepa et al., 2008, Fardet, 2010; Liu et al., 2024). Compared with white rice, brown rice consumption has been linked to lower blood cholesterol and glucose levels and reduced risk of cardiovascular disease, diabetes, and obesity (Kozuka et al., 2013). Despite its benefits, brown rice is less preferred by consumers, who favor polished rice for its appearance, taste, ease of cooking, tradition, safety, and shelf life. In contrast, brown rice has a harder texture, requires longer cooking, and has reduced shelf stability due to lipid content in the bran layer (Heiniö et al., 2016). Overcoming these drawbacks is critical for wider acceptance of brown rice in modern diets.
Cooking significantly influences the nutritional quality of rice, including glycemic index (GI), starch digestibility (SD), and chemical composition. Methods such as boiling, steaming, and pressure-cooking impact starch gelatinization and retention of nutrients. Heat-moisture treatment and steaming can modify starch crystallites and helices, resulting in slower digestion and reduced GI (Wang et al., 2020). Steam-treated starch enhanced the structure of crystallites and helices, which led to slower digestion (Wang et al., 2016). Selecting suitable cooking techniques is therefore essential to preserve nutritional properties of brown rice. SD is strongly affected by amylose content. High-amylose rice (≥25% amylose) is associated with lower serum triglycerides, reduced liver weight, and a lower postprandial glucose response (FAO). The ratio of amylose to amylopectin influences the rate of starch digestion (Denardin et al., 2007). Low-amylose brown rice (12–20% amylose) is more rapidly digested, leading to higher blood glucose levels (Cheng et al., 2022). Excessive consumption of white or milled rice has been linked to increased risks of diabetes, hypertension, obesity, and cardiovascular disease. The GI, which measures postprandial blood glucose response, classifies foods as high (≥70), medium (55-70), or low (≤55) (Atkinson et al., 2008). Low-GI foods improve glucose and lipid metabolism and enhance insulin sensitivity, making them beneficial for diabetes management. While brown rice and parboiled rice generally have lower GI values than white rice, the GI of cooked rice varies widely (48–93), depending on rice type, processing, cooking method, and recipe (Boers et al., 2015). Although high-amylose brown rice typically shows lower digestibility and GI, its hard texture limits consumer acceptance. Low-amylose brown rice varieties, such as jasmine rice, are valued for their softer texture and aroma (Chinachanta et al., 2021), but they are more rapidly digested and often exhibit higher GI (Sangwongchai et al., 2021), Milling produces brown rice by de-husking rough rice, but its limited water absorption and firm texture make it less palatable and less consumed (Ohtsubo et al., 2005). Optimizing the cooking of low-amylose brown rice could therefore balance consumer preference with metabolic health benefits.
This study hypothesized that specific cooking methods, particularly steaming, combined with optimized rice-to-water ratios, could reduce SD and GI of low--amylose brown rice while maintaining acceptable cooking qualities. Previous research has largely examined high--amylose or parboiled rice, with little attention to low-amylose cultivars. To address this gap, the purpose of this study was to investigate through the effects of different rice-to-water ratios (1:2, 1:3, and 1:4) as well as different cooking methods, such as electric cooking, microwave heating, steaming, and straining, on the chemical composition, DG, SD, RS, and estimated glycemic index (eGI) of cooked low-amylose brown rice. Furthermore, the study aimed to evaluate the microstructural and textural changes associated with each cooking condition in order to discover an optimal preparation method that reduces GI while retaining good sensory features.
Materials and Methods
Materials
Thai Jasmine rice (Oryza sativa L.) (Khao Dok Mali 105 cultivar), a low-amylose rice was obtained from the Department of Agricultural Product Technology at Mahasarakham University in Mahasarakham, Thailand. All chemicals were of analytical grade and acquired from BDH (Poole, UK) and Sigma-Aldrich (St Louis, Missouri, USA).
Sample preparation
Five kilograms of Jasmine paddy rice was de-husked using a rice rubber roller de-husking machinery (Satake Corporation, Tokyo, Japan) to obtain low-amylose brown rice samples. Broken kernels were discarded, and the brown rice samples were then placed in 1 kg aluminum zip lock bags and stored at 5 ± 1ºC in the refrigerator until use. The initial moisture and amylose contents of the brown rice sample were 10.86% and 15.82%, respectively.
Cooking low-amylose brown rice with various rice-to-water ratios
The effect of rice-to-water ratio on chemical compositions, sensory characteristics, texture profiles, RS, SD, DG, and eGI was investigated by cooking low--amylose brown rice in an electric cooker at three different ratios of rice-to-water of 1:2, 1:3, and 1:4 (w/w). A 240-g brown rice sample was rinsed three times with drinking water, drained, and immediately cooked using an electric cooker (2.2 L, KSH-D22, Thai City Electric Co., Thailand), and placed in the cooking pot with three different rice-to-water ratios (1:2, 1:3, and 1:4 (w/w)). The rice sample was cooked until the electric cooker automatically switched off (approximately 30 min), then simmered for an additional 5 min to ensure that it was fully cooked (Chin et al., 2020; Yao et al., 2023). Considering the chemical composition, DG, eGI, and texture profile of cooked low-amylose brown rice (CBR), the 1:3 rice-to-water ratio was identified as the most appropriate condition for further investigation.
Preparation of CBR using different methods
The brown rice sample was rinsed three times with drinking water, then drained, and immediately cooked using one of four methods with a 1: 3 rice-to-water ratios, all of which adhere to standard Asian household rice cooking practices. All treatments were prepared using the same rice batch, processed on the same day, and cooked in triplicate.
Electrical cooker
Brown rice (250 g) was placed in the cooking pot, with an optimal rice-to-water ratio of 1:3 (w/w) based on research from the first part. The rice sample was cooked in an electric cooker until the appliance switched off automatically and then simmered for a further 5 min (total cooking time was 35 min), to ensure that it was completely cooked (Chin et al., 2020; Yao et al., 2023).
Conventional method
In a 2-L stainless-steel vessel, 240 g of brown rice was prepared using a 1:3 (w/w) rice-to-water ratio. Heating was continued until a stable, vigorous boil was achieved, which marked the start of the cooking duration. The rice was subsequently boiled for 30 min, during which kernel gelatinization became visually apparent and the cooking medium was largely reduced. Residual water was then decanted, and the rice was covered and held under low-heat simmering conditions for an additional 15 min to ensure complete starch gelatinization and uniform -cooking (Chin et al., 2020; Yao et al., 2023).
Steaming treatment
Brown rice samples (240 g each) were placed in wide, shallow, stainless-steel steaming containers (1.3 L) and cooked using a 1:3 (w/w) rice-to-water ratio. The containers were positioned in a stainless-steel household steamer above vigorously boiling water, ensuring that the grains were exposed to saturated steam without direct contact with liquid water. Steaming time was recorded from the point at which continuous steam visibly reached and surrounded the rice containers, indicating that the internal steaming environment had stabilized. The rice was steamed for 30 min under these conditions, followed by a 5-min holding period to allow uniform heat distribution and complete moisture absorption.
Microwave heating
Microwave cooking was performed in a 900-W household microwave oven (Samsung ME82, Korea). Brown rice (240 g) was placed in a wide, shallow 1.3-L heat--resistant borosilicate container with a lid and mixed with water at a 1:3 (w/w) rice-to-water ratio. The sample was microwaved for 30 min or until the cooking water was fully absorbed, after which it was left to stand for 5 min to allow residual heat to complete the cooking process (Yao et al., 2023). All treatments used rice from the same batch, were prepared on the same day, and were cooked in triplicate.
Proximate composition analysis
The proximate composition of CBR samples was analyzed following the official AOAC methods (AOAC, 2000).
DG analysis
The DG was measured according to the method of Birch and Priestley (1973). In brief, CRB samples were dried in a hot air oven (60°C) to obtain 10% moisture (% wet basis) before being ground and passed through an 80-mesh sieve. Each 0.2 g sample was added with distilled water and KOH, stirred for 5 min, and centrifuged. The supernatant was combined with HCl, water, and iodine solution, and then homogenized. Absorbance at 600 nm was measured and compared to a starch standard curve to determine gelatinization.
Total starch (TS) analysis
Enzymatic analysis was used to determine the TS content of raw and cooked brown rice samples (Goni et al., 1996). In brief, CBR powder (100 mg) was mixed with 5 mL of 80% ethanol, heated (80–85°C, 5 min), vortexed, and centrifuged (10 min, 3,000 rpm). The supernatant was combined with 2 mL of 2 M KOH and agitated in an ice bath (20 min). The mixture was then added to sodium acetate buffer (pH 3.8) with α-amylase and amyloglucosidase, followed by centrifugation and incubation (50°C, 30 min) before analysis using a D-Glucose test kit (GOPOD Format) (Megazyme International Ireland Ltd., Wicklow, Ireland).
Starch leaching (SL) analysis
SL of the UCBR and CBR samples were evaluated by adopting the method of Williams et al. (1970). Five grams of the sample were mixed with 10 mL of distilled water, vortexed (2 min), and centrifuged (3200 rpm, 10 min). The supernatant (2 mL) was mixed with ethanol (8 mL), then 1 mL of the solution was combined with sodium acetate buffer and amyloglucosidase and incubated (60°C, 45 min). Sugar content was analyzed using a D-Glucose assay kit, with glucose concentration converted to starch by multiplying by 0.9.
SD and eGI analysis
SD and eGI of the UCBR and CBR samples were determined according to the method of Goni et al. (1997). All in vitro digestion assays were initiated within 60 min after cooking. During this period, cooked samples were kept at 37–40°C in sealed containers to minimize starch retrogradation prior to enzymatic digestion. Samples underwent enzymatic digestion, with glucose content analyzed using a D-Glucose assay kit. Starch hydrolysis rates were expressed using a nonlinear model.
C = C∞ (1–ekt)(1)
where C is the percentage of hydrolyzed starch at time t, C∞ is the percentage of hydrolyzed starch after 180 min, t is time (min), and k is the kinetic constant (min−1). The information gathered from the in vitro hydrolysis process was used to estimate the parameters C∞ and k for each treatment. The following formula was utilized to determine the area under the hydrolysis curve (AUC):
AUC = C∞ (tf–t0) – [(C∞ /k) [1–exp[–k(tf-t0)]](2)
where tf represents the final time (180 min), and t0 is the initial time (0 min). The hydrolysis index (HI) was determined by calculating the ratio of the area under the hydrolysis curve of the treated sample to that of white bread. The HI served as a reliable predictor of the glycemic response. Consequently, the eGI was calculated using the following equation (Goni et al., 1997).
eGI = 39.71 + 0.549(HI)(3)
SEM analysis
UCBR and CBR samples obtained from various cooking techniques were freeze-dried before being fixed to an aluminum sample holder. After being gold coated, each sample was examined under high vacuum with an accelerating voltage of 10.0 kV and at a working distance of 30.0 mm using a SEM (JSM-6460L model, JEOL, USA).
Sensory evaluation
A sensory evaluation was conducted with 30 untrained panelists of different ages and genders. Participants assessed appearance, color, odor, flavor, texture, and overall acceptability using a nine-point hedonic scale (1 = “dislike extremely,” 9 = “like extremely”). Each panelist received three cooked brown rice samples (8 g each), served at 40–45°C, labeled with random three-digit codes, and presented in a randomized order to minimize bias.
This study was conducted in accordance with approved guidelines, following ethical approval from the Human Research Ethics Committee of Mahasarakham University (Approval No. 0605.2(1)/1122).
Textural profile analysis
The texture profiles of CBR prepared with various rice-to-water ratios and cooking methods were evaluated using a Texture Analyzer (TA-XT2i, Texture Technologies Corp., Surrey, UK) and a texture expert software program, following a modified version of the standard procedure (Zhang et al., 2023). Prior to testing, the CBR samples were cooled to 30 ± 2°C B for 30 min and placed in a plastic cylinder. A two--cycle compression program was applied, compressing the rice gel to a depth of 10 mm at a crosshead speed of 2 mm/min, using a 35 mm cylindrical probe with a flat end. The software then calculated texture parameters, including hardness, cohesiveness, chewiness, and springiness.
Statistical analysis
Data for each treatment were collected from three independent samples and expressed as means ± standard deviations. One-way ANOVA (SPSS trial version) was used to analyze proximate composition, RS, SL, DG, SD, eGI, and textural properties of CBR prepared with three rice-to-water ratios and four cooking -methods. Sensory scores of CBR across different rice--to-water ratios were analyzed using one-way ANOVA in a randomized complete block design (RCBD). Duncan’s multiple range test was applied to identify significant differences between treatments, with statistical significance set at p < 0.05.
Results and Discussion
Effect of rice-to-water ratio on chemical composition and DG
Cooking with a higher rice to water ratio increased moisture, SL, and DG content in CBR (p < 0.05), while it decreased the RS content (Table 1). The results clearly showed that raising the rice-to-water ratio during cooking had a significant effect on the physicochemical qualities of rice. Moisture content grew significantly as the water ratio increased, with the maximum value recorded at a 1:4 ratio (64.7%). This result is similar with recent studies (Wani et al., 2012), which showed that increased water absorption caused expansion of starch granules and a softer texture in cooked rice. In contrast, protein content showed a slight but consistent decrease across all CBR samples compared to the control (UCBR). This reduction can be attributed to a dilution effect due to higher moisture content and potential leaching of nitrogenous compounds during cooking, aligning with earlier studies (Juliano, 1993). However, no significant difference was observed among the cooked samples, suggesting that protein remains relatively stable across typical household cooking water levels.
Table 1. Chemical composition and degree of gelatinization of uncooked and cooked low-amylose brown rice cooked in an electric cooker using different rice-to-water ratios.
| Parameter | Ratio of rice to water | |||
|---|---|---|---|---|
| UCBR | 1: 2 | 1:3 | 1:4 | |
| Moisture (g/100g)* | 10.7 ± 0.17d | 46.89 ± 1.41c | 57.7 ± 1.27b | 64.7 ± 1.82a |
| Protein (g/100g) | 9.39 ± 0.16a | 8.59 ± 1.07b | 8.69 ± 0.58b | 8.87 ± 0.59b |
| Fat (g/100g) | 2.72 ± 0.13a | 2.49 ± 0.04b | 2.35 ± 0.08b | 2.35 ± 0.12b |
| Fiber (g/100g) | 2.12 ± 0.04a | 1.97 ± 0.06a | 1.83 ± 0.34a | 1.98 ± 0.01a |
| Ash (g/100g) | 1.72 ± 0.08a | 1.41 ± 0.01b | 1.27 ± 0.06b | 1.38 ± 0.09b |
| Resistant starch (%) | 2.71 ± 0.07a | 2.74 ± 0.24a | 1.81 ± 0.22b | 1.02 ± 0.03c |
| Starch leaching (%) | – | 0.86 ± 0.17c | 2.04 ± 0.17b | 3.38 ± 0.15a |
| DG (%) | – | 81.30 ± 2.13b | 98.4 ± 2.42a | 98.9 ± 1.95a |
Values are means ± SD from triplicate samples (dry matter) (*based on wet matter).
a–cLetters within a row with different superscripts indicate a significant difference (p < 0.05).
UCBR refers to uncooked low-amylose brown rice or raw low-amylose brown rice.
DG stands for degree of gelatinization (DG) (%).
Fat and ash contents also declined significantly with increasing water ratios. This reduction is likely caused by the leaching of lipids and minerals into the cooking water, particularly from the outer layers of the grain, as supported by Lu et al. (2015). Notably, RS content decreased substantially with higher water ratios. While both raw and 1:2 samples retained RS levels around 2.7%, the value dropped sharply to 1.02% at the 1:4 ratio. This decline is likely due to the extensive gelatinization that occurs under high moisture conditions, which disrupts the crystalline structures essential for RS formation (Zhu, 2015). This finding is particularly important as RS is associated with lower glycemic responses and gut health benefits; thus, higher water ratios may reduce the functional quality of rice in this regard.
SL and the DG increased significantly with the water ratio. The highest SL (3.38%) and DG values (~99%) were recorded at the 1:4 ratio, suggesting that rice cooked with more water becomes more digestible. This agrees with the work of Singh et al. (2006), who reported that extensive gelatinization enhances enzymatic digestibility. Interestingly, dietary fiber content did not differ significantly across treatments, indicating that the insoluble fiber in rice remains stable despite varying cooking conditions. This study is novel in examining how the rice-to-water ratio influences RS, SL, and DG, an aspect often neglected in conventional rice cooking research. Unlike earlier work focused on texture and nutrient loss, it shows that cooking water volume affects digestibility and lowers RS, impacting glycemic response and nutritional quality. These results provide useful guidance for dietary planning, especially for managing blood sugar and improving the health value of staple foods like rice.
Effect of rice-to-water ratio on sensory evaluation
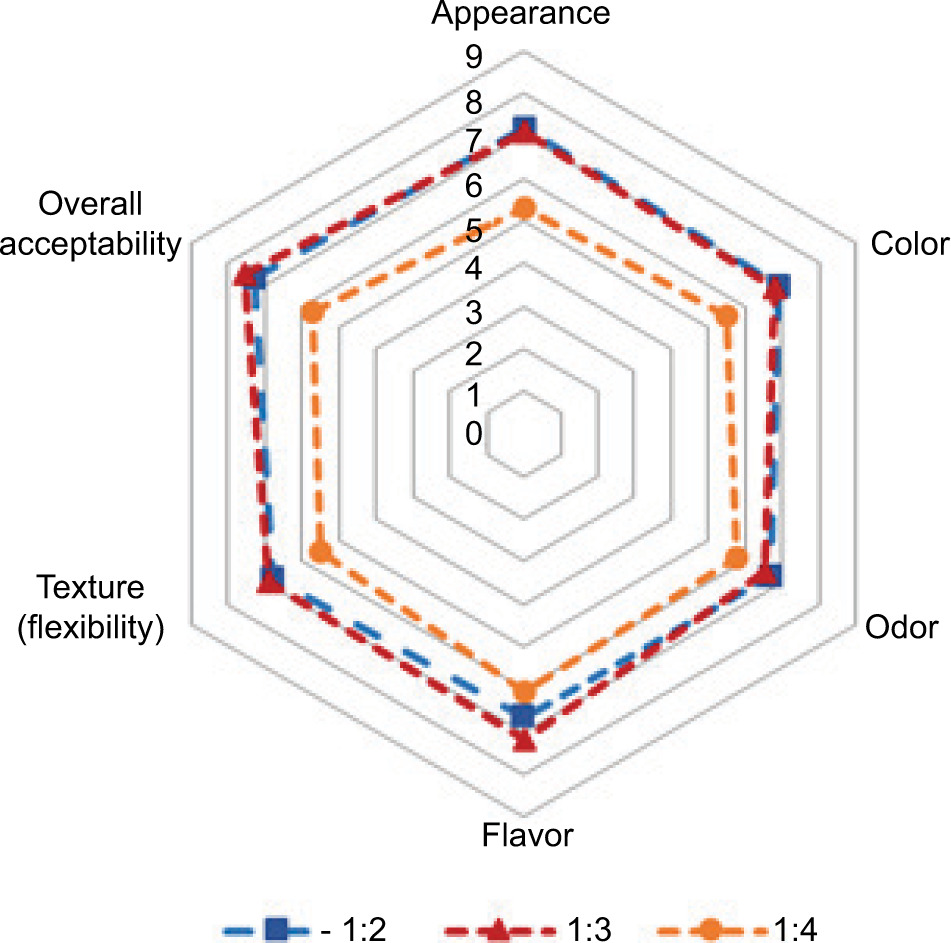
The rice-to-water ratio significantly influenced all -sensory attributes of brown rice (Figure 1). Among the tested ratios, 1:3 achieved the highest overall sensory scores, whereas 1:4 resulted in the lowest ratings across attributes. These results support previous studies showing that intermediate or recommended water -levels provide an optimal balance of grain softness, cohesiveness, and structural integrity, while both insufficient and excessive water reduce eating quality (Bett-Garber et al., 2007; Saleh, 2017). At a 1:3 ratio, grains were adequately hydrated, producing favorable texture, appearance, and flavor, consistent with reports that properly cooked brown rice receives higher scores for color, texture, and overall acceptance than under- or overcooked samples (Loan et al., 2024). In contrast, the 1:2 ratio likely resulted in incomplete hydration, yielding firmer and chewier grains that were acceptable to some panelists but scored lower for texture and flavor. Similar trends have been observed in Thai and Australian rice cultivars, where low water ratios increase hardness and chewiness while reducing stickiness and overall acceptability, particularly in brown rice with intact bran layers (Srisawas & Jindal, 2007). Conversely, the 1:4 ratio likely caused overhydration, leading to excessive swelling, increased stickiness, diluted flavor, and paler appearance. This aligns with findings that higher water levels decrease hardness and springiness while increasing slickness and reducing flavor intensity (Bett-Garber et al., 2007; Saleh, 2017).
Figure 1. Sensory evaluation of uncooked and cooked brown rice cooked in an electric cooker using different rice-to-water ratios.
Effect of rice-to-water ratio on the textural profiles
The study investigated the influence of different rice-to-water ratios on the texture profile of CBR prepared in an electric rice cooker (Table 2). The findings indicated that the rice-to-water ratio significantly affected the degree of cooking using a texture profile analysis (p < 0.05). At a ratio of 1:2, the CBR exhibited a partially undercooked texture, with a visible opaque white core remaining inside the grain which was confirmed by DG (81.30%). Cooking at a 1:3 ratio produced rice that was fully cooked, soft, cohesive, and aligned with desirable eating quality. Conversely, at a 1:4 ratio, the rice was overcooked, resulting in an undesirable mushy texture. Hardness was significantly influenced by the rice-to-water ratio (p < 0.05). The 1:2 ratio produced the highest hardness value (16.91 N), followed by the 1:3 ratio (10.33 N), while the 1:4 ratio resulted in the lowest hardness (7.85 N). Cohesiveness (0.26–0.29) and springiness (0.48–0.56 mm) were not significantly affected by the rice-to-water ratio (p ≥ 0.05). Chewiness was significantly influenced by water levels (p < 0.05): rice cooked at a 1:2 ratio exhibited the highest chewiness (2.19 Nmm), whereas the 1:3 and 1:4 ratios resulted in markedly lower values (0.95 and 0.89 Nmm, respectively).
Table 2. Textural profiles of uncooked and cooked brown rice cooked in an electric cooker using different rice-to-water ratios.
| Rice-to-water ratio | Hardness (N) | Cohesiveness | Springiness (mm) | Chewiness (Nmm) |
|---|---|---|---|---|
| 1:2 | 16.91 ± 0.55a | 0.29 ± 0.03a | 0.56 ± 0.07a | 2.19 ± 0.39a |
| 1:3 | 10.33 ± 0.82b | 0.27 ± 0.04a | 0.50 ± 0.18a | 0.95 ± 0.47b |
| 1:4 | 7.85 ± 0.16c | 0.26 ± 0.02a | 0.48 ± 0.09a | 0.89 ± 0.23b |
a-cLetters within a column with different superscripts indicate a significant difference (p < 0.05).
The findings highlight the critical role of water availability during cooking in determining the texture of brown rice. Insufficient water (1:2 ratio) limited starch gelatinization, resulting in higher hardness and chewiness values, as well as the presence of an uncooked core. These results are consistent with earlier studies suggesting that water content during cooking strongly influences starch swelling and gelatinization, thereby affecting hardness and mastication properties (Kong and Singh, 2008). At the optimal rice-to-water of 1:3 ratio, the balance between water absorption and starch gelatinization resulted in a softer texture and improved palatability, consistent with consumer preferences. By contrast, excessive water (1:4 ratio) disrupted the structural integrity of rice grains, leading to excessive SL, over-softening, and mushiness. This phenomenon is supported by previous findings that excess water reduces hardness but also compromises structural cohesiveness (Yu et al., 2015). Interestingly, cohesiveness and springiness were unaffected by rice-to-water ratio. This suggests that inter-granular adhesion and resilience are more dependent on starch composition and amylose-to-amylopectin ratio than water levels alone (Patindol et al., 2010). Overall, these results provide practical implications for optimizing cooking ratios in electric rice cookers, particularly for brown rice, which requires higher water absorption due to the presence of bran layers.
Although the 1:3 rice-to-water ratio produced the most favorable sensory scores, the 1:2 ratio still yielded rice with acceptable qualities, characterized by a firmer, chewier texture and greater grain separation. This profile may be positioned for consumers who prefer less sticky, well-separated grains or for dishes where such a texture is desirable. To enhance consumer acceptance of rice prepared at a 1:2 ratio, minor adjustments to cooking practices, such as pre-soaking the grains or extending the cooking time, could improve hydration and soften the texture while maintaining structural integrity. Additionally, framing these characteristics in terms of potential nutritional or functional benefits, such as enhanced satiety or slower digestion associated with firmer brown rice, may further align consumer expectations with the sensory attributes of rice cooked at lower water levels.
Effect of rice-to-water ratio on SD and eGI
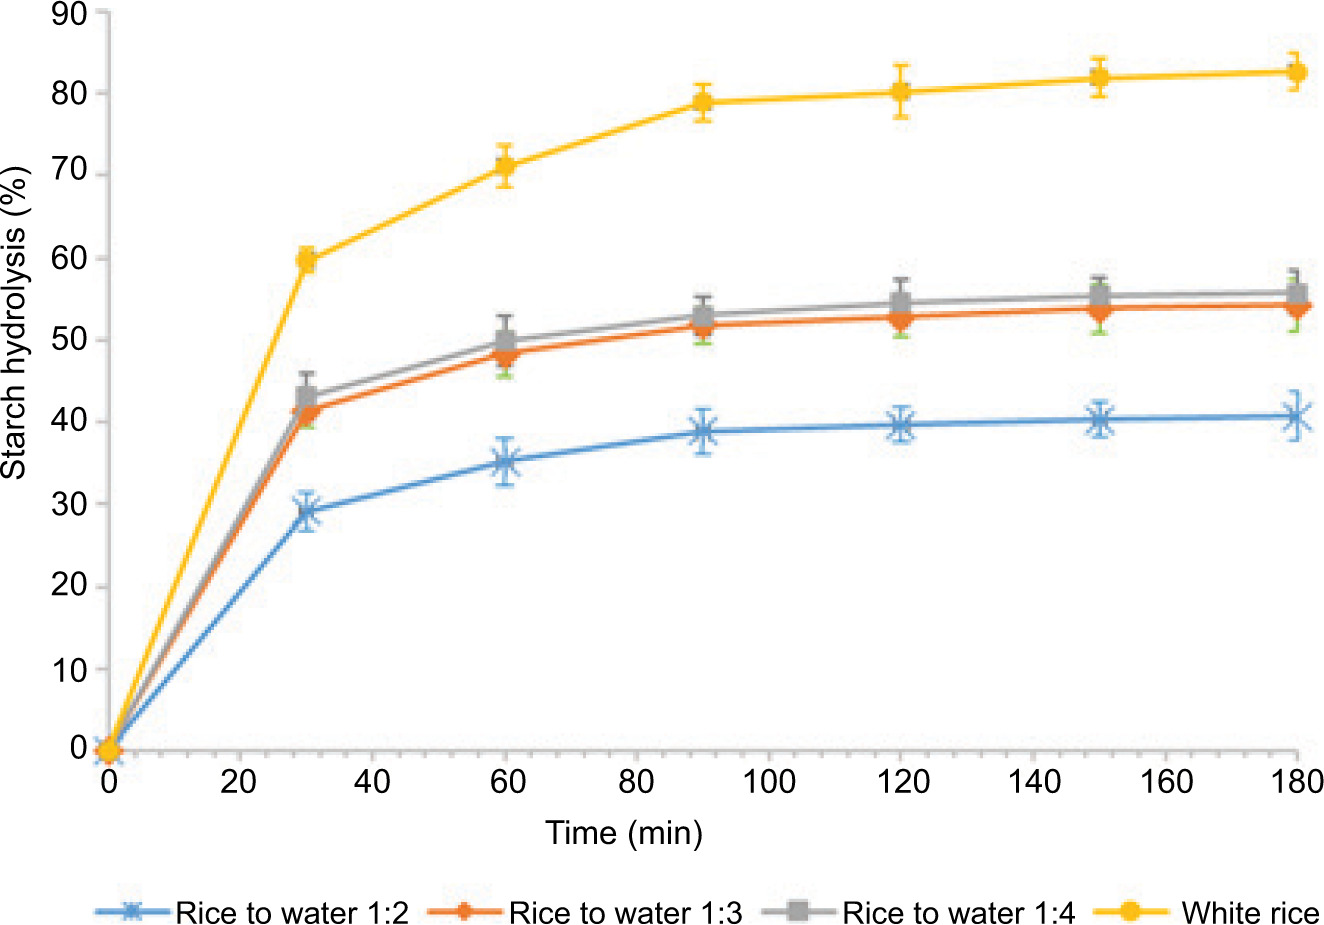
The effect of different water-to-rice ratios on SD and eGI of CBR sample was assessed by measuring key kinetic parameters, including C∞, k, HI, and eGI. The results show that increasing the water-to-rice ratio significantly enhances SD and eGI. At a 1:2 ratio, the equilibrium concentration of C∞ was 40.08%, while it increased significantly to 53.16% and 54.63% at 1:3 and 1:4, respectively (Figure 2). This suggests that more moisture content during cooking facilitates more extensive starch gelatinization, thus making starch more accessible to enzymatic hydrolysis. The k also showed a slight increase from 0.04 to 0.05 min–1 with higher water content, indicating faster hydrolysis. Correspondingly, the HI, an indicator of how quickly starch is broken down, rose sharply from 51.41 at 1:2 to over 71.97 at 1:4 (Table 3). The eGI followed a similar trend, increasing from 67.94 to 79.22. These findings clearly demonstrate that cooking brown rice with a higher water volume result in significantly higher digestibility and glycemic response. Such an outcome is particularly important for individuals managing blood glucose levels, as higher eGI foods tend to cause more rapid spikes in blood sugar. CBR with rice to water ratio of 1:2 had lower values of HI and eGI than other ratios. The hydrolysis rate of native granules is much slower than that of gelatinized starch (Lee and Lee, 2005). The findings were comparable to those of Vîrlan et al. (2024), who observed that longer cooking durations or higher rice-to-water ratios in all rice varieties resulted in higher SD and eGI, as well as enzyme accessibility. Furthermore, uncooked or minimally cooked rice had a lower SD because it digests more slowly, which results in a lower GI (Jung et al., 2009). Furthermore, reduced cooking intensity and sufficient water facilitate maintaining starch structure and a lower GI in rice (Frei et al., 2003; Ranawana et al., 2009). Less intensive cooking methods result in a lower glycemic response (Ranawana et al., 2009).
Figure 2. Starch hydrolysis of cooked low-amylose white rice and brown rice with different rice-to-water ratios. Each -observation is the mean ± SD of replicate experiments (n=3). The vertical bars on each column indicate the standard deviation.
Table 3. Equilibrium concentration (C∞), kinetic constant (k), hydrolysis index (HI), and estimated glycemic index of brown rice cooked by different ratios of rice to water using an electric rice cooker.
| Ratio of rice to water | C∞ (%) | k (min–1) | HI | eGI |
|---|---|---|---|---|
| 1:2 | 40.08 ± 0.13b | 0.04 ± 0.001b | 51.41 ± 0.40b | 67.94 ± 0.22b |
| 1:3 | 53.16 ± 1.23a | 0.05 ± 0.002a | 69.74 ± 1.75a | 77.99 ± 0.96a |
| 1:4 | 54.63 ± 0.88a | 0.05 ± 0.001a | 71.97 ± 1.20a | 79.22 ± 0.66a |
a,bLetters within a column with different superscripts indicate a significant difference (p < 0.05).
This study demonstrated that the water-to-rice ratio during cooking plays a pivotal role in modulating the SD kinetics and eGI of CBR. By systematically quantifying the k, HI, and eGI, the research provides novel evidence that increasing water volume enhances starch gelatinization, thereby accelerating enzymatic hydrolysis and elevating glycemic potential. Such an approach is rarely explored in brown rice research, and it highlights the metabolic implications of a simple but critical cooking parameter. The novelty of this work lies in its integration of in vitro SD kinetics with cooking water volume, offering new insights into dietary management strategies for populations concerned with postprandial glycemic control. The findings contribute to the optimization of household cooking practices to improve consumer acceptability of CBR, supporting its promotion as a healthier dietary staple. Although the 1:2 water-to-rice ratio produced a higher eGI, the 1:3 ratio was selected for cross-method comparisons because it ensured fully cooked and acceptable rice across all cooking techniques. The 1:2 ratio appeared acceptable only in the electric cooker; however, when applied to conventional cooking, steaming, and microwave cooking, methods with different heat transfer and evaporation patterns, it could result in incomplete hydration. In contrast, the 1:3 ratio consistently yielded uniformly cooked grains with the highest sensory acceptability, ensuring that all methods produced rice that was properly cooked and suitable for evaluation. Thus, 1:3 was used as the standardized condition to maintain methodological consistency for comparison among cooking methods.
Effect of cooking methods on the chemical composition and DG
Table 4 shows the chemical composition analysis results of UCBR and CBR samples obtained from different methods of cooking. It was discovered that cooking methods had no significant effect on protein (6.83–8.69 g/100 g), fat (2.28–2.45 g/100 g), fiber content (1.79–2.11 g/100 g), or moisture (54.7–57.7 g/100 g). These findings aligned with the findings of Kaur et al., (2023), who found that boiling reduced the products’ protein content compared to the raw, uncooked wheat flour sample (11.3%). However, the ash content showed a significant difference (p < 0.05) between cooking methods. Among these cooking methods, CBR using microwave heating (CBR-MH) and steaming treatment (CBR-ST) had significantly higher ash content (1.51 and 1.41 g/100 g, respectively), whereas the lowest value was observed in cooked brown rice using conditional or straining method (CBR-CM). This is because soluble ash concentration was decreased by employing traditional and electric cooking methods, which removed extra water. Similar findings were found in the study of Chapagai et al. (2017), which found that leaching micro- and macromolecules during cooking induced by boiling the rice kernels resulted in the loss of minerals like iron. When compared to uncooked brown rice, the Fe content of CBR was decreased by pressure and electrical cooking (Chapagai et al., 2017). Brown rice’s bran layer and its proximate chemical compositions are rich in nutrients, including vitamins and minerals, some of which are soluble in water (Sapwarobol et al., 2021).
TS, RS, SL, DG, and free glucose of cooked rice samples prepared from different cooking processes are displayed in Table 4. Overall, no significant difference (p ≥ 0.05) in TS and RS of CBR samples were observed between cooking methods. The CBR prepared from all methods had a lower level of TS and RS compared to UCBR. This is because cooking the starchy endosperm using water breaks down the TS into free sugar, which lowers the TS in all CBRs. The findings were consistent with Chapagai et al. (2017), who reported leaching of some portion of starchy endosperm in the form of gruel (unrecoverable) during rice cooking. When foods containing water and starch granules are heated, they absorb moisture, expand, and gelatinize, leading to amylose breakdown and washing out of the solution (Sapwarobol et al., 2021). On the other hand, cooking methods affected significantly (p < 0.05) the levels of SL, DG, and free glucose in CBR. Among these cooking methods, The CBR-EC exhibited the highest level of DG (99.0%) and comparable to CRB-CM (98.9%), whereas the lowest level for DG was found in CBR-MH and CBR-ST, which were 94.4% and 90.9%, respectively. Moreover, CBR-ST and CBR-EC showed the highest amount of starch leashing and free glucose, while the lowest values were found in CBR-ST and CBR-MH for SL and free glucose, respectively. Compared to UCRB, CBR samples had a higher level of free glucose ranging from 0.12 to 0.29%. This is because, compared with other cooking methods, steaming provides less available moisture for starch gelatinization, resulting in a lower degree of gelatinization. The DG changes the physicochemical, organoleptic, and gastrointestinal characteristics of starchy food by influencing the structural organization and characteristics of starch. As DG increases, the molecules’ structural arrangement within the starch granules is gradually upset, the granules’ swelling and subsequent disruption change their particle size, the crystallinity and molecular weight decrease, and starch–lipid complexes are created (Yan et al., 2024). Traditional wet-heat procedures, such as boiling, offer sufficient moisture for full gelatinization, whereas current dry-heat techniques or ones that use less water (such as MH) may result in partial or controlled starch breakdown (Frei et al., 2003). Cereal starches undergo changes when cooked, such as the gelatinization and physical and chemical disruption of starch granules. However, the level of gelatinization depends on the temperature, cooking time, and water quantity (de Souza Batista et al., 2019; Sapwarobol et al., 2021). The cooking significantly decreased (p < 0.05) the RS content of brown rice compared with UCBR due to factors such as temperature, cooking duration, moisture content, and retrogradation effects. High heat and prolonged cooking break down starch granules, making them more digestible and reducing RS content, while excessive water use further disrupts the starch structure, decreasing RS formation. Although cooking brown rice decreased RS, the presence of both amylose and lipids in brown rice allows for the formation of an amylose–lipid complex during cooking (Frei et al., 2003). In addition, cooling cooked rice allows amylose molecules to realign into a crystalline structure. The formation of the amylose–lipid complex and retrogradation make the starch more resistant to enzymatic digestion (Photinam & Moongngarm, 2023). Therefore, it is likely that the reduction in RS content was slightly reduced compared to raw rice. In addition, cooking techniques that use less water and shorter durations, such as steaming, tend to preserve more RS compared to prolonged boiling. In contrast, pressure cooking may reduce RS content due to higher temperatures breaking down starch more effectively. Furthermore, different cooking methods can influence enzyme interactions and pH changes, affecting starch hydrolysis and RS content. Overall, cooking methods that limit excessive heating, extended cooking durations, and high water usage, while facilitating cooling and starch retrogradation, are more likely to enhance the resistant starch (RS) content in brown rice (Li et al., 2019). The novelty of this research lies in the comparative analysis of four cooking methods, including electric cooker, conventional boiling, steaming, and microwave heating, on not only the proximate composition but also functional starch properties such as RS, SL, free glucose release, and DG in CBR. Unlike most prior studies that focused primarily on white rice or just nutritional composition, this study offers new insights into how modern cooking appliances (e.g., CBR-EC and CBR-MH) influence both nutritional quality and glycemic-related starch behavior. Particularly, this study quantified how microwave cooking retains more ash and leads to moderate gelatinization, balancing between nutrient preservation and SD. The data also show that steaming causes the least SL and glucose release, which may be beneficial for developing brown rice products with lower glycemic impact. These findings have direct implications for public health recommendations and consumer cooking practices, especially for individuals seeking to manage postprandial glucose responses while maintaining the nutritional integrity of whole grains.
Table 4. Chemical compositions and degree of gelatinization of uncooked and cooked low- amylose brown rice samples obtained from different cooking processes.
| Parameter | Cooking method | ||||
|---|---|---|---|---|---|
| UCBR | CBR-CM | CBR-EC | CBR-ST | CBR-MH | |
| Moisture (g/100g)* | 10.8 ± 0.16b | 55.2 ± 2.10a | 57.7 ± 1.26a | 56.1 ± 1.82a | 54.7 ± 2.93a |
| Protein (g/100g) | 9.42 ± 0.06a | 6.83 ± 0.42b | 8.67 ± 0.13b | 8.29 ± 0.18b | 8.11 ± 0.26b |
| Fat (g/100g) | 2.92 ± 0.13a | 2.28 ± 0.18b | 2.35 ± 0.19b | 2.41 ± 0.34b | 2.45 ± 0.11b |
| Fiber (g/100g) | 2.12 ± 0.04a | 2.06 ± 0.43a | 1.79 ± 0.33a | 2.11 ± 0.29a | 1.93 ± 0.23a |
| Ash (g/100g) | 1.72 ± 0.08a | 1.08 ± 0.10d | 1.34 ± 0.06c | 1.41 ± 0.01b | 1.51 ± 0.01b |
| Total starch (%) | 83.9 ± 0.19a | 81.0 ± 2.29b | 80.7 ± 5.19b | 80.5 ± 3.37b | 82.0 ± 2.71b |
| Resistant starch (%) | 2.69 ± 0.04a | 2.54 ± 0.27b | 2.51 ± 0.17b | 2.44 ± 0.11b | 2.46 ± 0.31b |
| Starch leaching (%) | – | 1.92 ± 0.12ab | 2.03 ± 0.16a | 1.32 ± 0.10c | 1.81 ± 0.10b |
| Free glucose (%) | 0.11 ± 0.01c | 0.28 ± 0.02a | 0.29 ± 0.01a | 0.20 ± 0.03b | 0.12 ± 0.01c |
| DG (%) | – | 98.9 ± 0.23a | 99.0 ± 0.29a | 90.9 ± 1.35b | 94.4 ± 1.91b |
Values are averages ± SD from triplicate samples (dry matter) (*based on wet matter).
a–cLetters within a row with different superscripts indicate a significant difference (p < 0.05).
UCBR refers to uncooked low-amylose brown rice or raw brown rice.
CBR-CM refers to cooked low-amylose brown rice using conventional method.
CBR-EC refers to cooked low-amylose brown rice using an electric cooker.
CBR-ST refers to cooked low-amylose brown rice using steaming treatment.
CBR-MH refers to cooked low-amylose brown rice using microwave heating.
DG stands for degree of gelatinization (%).
Effect of cooking methods on SD and eGI
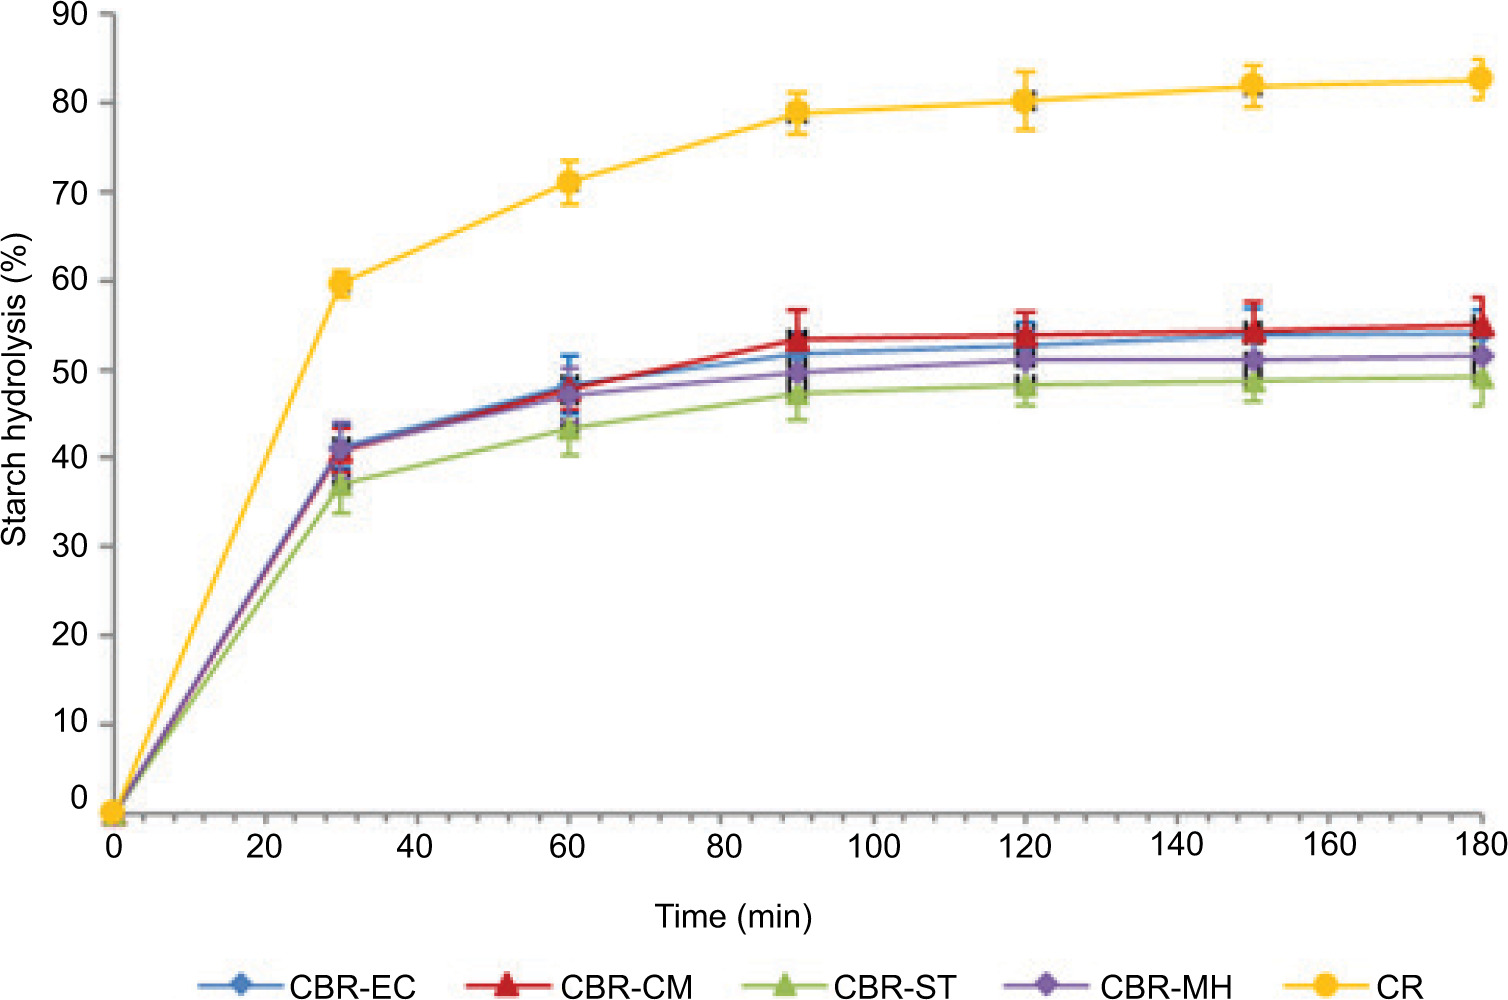
The rate of SD plays a key role in evaluating a food product’s impact on blood glucose levels. This rate is measured by monitoring glucose levels for up to 180 min from the start of digestion. Rapidly digestible starch is broken down within 20 min, slowly SD is processed by 120 min, and total SD is completed by 180 min (Li et al., 2017). Figure 3 shows TS hydrolysis of cooked low-amylose white rice (CR) and CBR prepared from different methods. Overall, cooking methods significantly (p < 0.05) affected the TS hydrolysis of cooked rice. Among these cooking methods, CBR samples showed the slowest hydrolysis rate, whereas the lowest value was found in CBR-CM and CBR-EC. Moreover, the time required to reach maximum hydrolysis was approximately 90 min for all cooking methods. However, the maximum hydrolysis values for steaming, microwave heating, electric cooking, and conventional methods were 48.5 50.2, 53.2 and 54.2%, respectively. Compared to CR, CBR samples from all cooking methods had a lower rate of hydrolysis. This is because heat is produced at high temperatures (over 100°C) during steaming and microwave treatments, which quickly reduces digestible starch. The results were consistent with those published by Li et al. (2017), who found that a high-temperature air fluidization treatment at 110°C, 130°C, and 150°C initially reduced SD and gradually increased RS levels in germinated brown rice. The SD of brown rice was lowered by raising the cooking temperature from 72°C to 88°C (de Souza Batista et al., 2019). In addition, heat–-moisture treatment of brown rice flour enhanced the RS content while decreasing the rapidly digested starch amount in Korean rice-based cakes (Kim et al., 2017).
Figure 3. Starch hydrolysis of cooked low-amylose white rice (CR) and brown rice prepared form different methods. CBR-EC = cooked low-amylose brown rice using an electric cooker; CBR-CM = cooked low-amylose brown rice using the -conventional method; CBR-ST = cooked low-amylose brown rice using the steaming treatment. CBR-MH = cooked low-amylose brown rice using microwave heating. Each observation is the mean ± SD of replicate experiments (n=3). The vertical bars on each column indicate the standard deviation.
The high R2 values of 0.99 indicate starch hydrolysis kinetics (Table 5). C∞ directly impacts HI and eGI values. HI and eGI decreased with decreasing C∞ levels. The eGI value of reference brown rice was 76, which represents a high GI food (Boers et al., 2015). CBR-ST had the lowest HI and eGI compared with other -methods, perhaps due to incomplete gelatinization. The results were in line with Lee and Lee (2005), who found that microwave-cooked or electric-cooked rice samples showed a stronger structure and lower DG than autoclave-cooked rice. The degree of starch hydrolysis and DG in autoclave-cooked rice samples had a positive correlation (Han et al., 2008). Physicochemical changes arising from different heat-transfer mechanisms contribute to the variation observed across cooking methods. Each heating technique differs in its ability to disrupt starch granules and alter starch structure, thereby influencing SD and GI values (Mahadevamma & Tharanathan, 2007). In addition, the SD of cooked rice is affected by multiple factors, including food processing conditions, specific cooking methods, and the structural characteristics of amylopectin. It is important to note that all eGI values in this study were obtained using in vitro digestion, which may not fully represent true in vivo glycemic responses. Furthermore, the cooked rice samples were analyzed immediately after preparation, without undergoing a cooling or storage period. Previous research has established that refrigerated storage such as holding cooked rice for 24 hours at 4°C promotes starch retrogradation, increases RS content, and potentially lowers the glycemic response. Future investigations should therefore assess the effects of cooling and storage on starch properties and eGI values.
Table 5. Correlation coefficient between physicochemical properties and glycemic indexes of cooked low-amylose brown rice.
| Variables | Protein | SL | Hardness | DG | HI | eGI |
|---|---|---|---|---|---|---|
| Protein | – | −0.166 | 0.406 | −0.231 | −0.414 | −0.414 |
| SL | – | −0.756* | 0.781* | 0.759* | 0.760* | |
| Hardness | – | −0.521 | −0.751* | −0.751* | ||
| DG | – | 0.796* | 0.797* | |||
| HI | – | 1.000* | ||||
| eGI | – |
*Significant difference (p < 0.05). SL refers to starch leaching. HI refers to the hydrolysis index. DG stands for degree of gelatinization. eGI stands for estimated glycemic index.
Effect of cooking method on texture characteristics
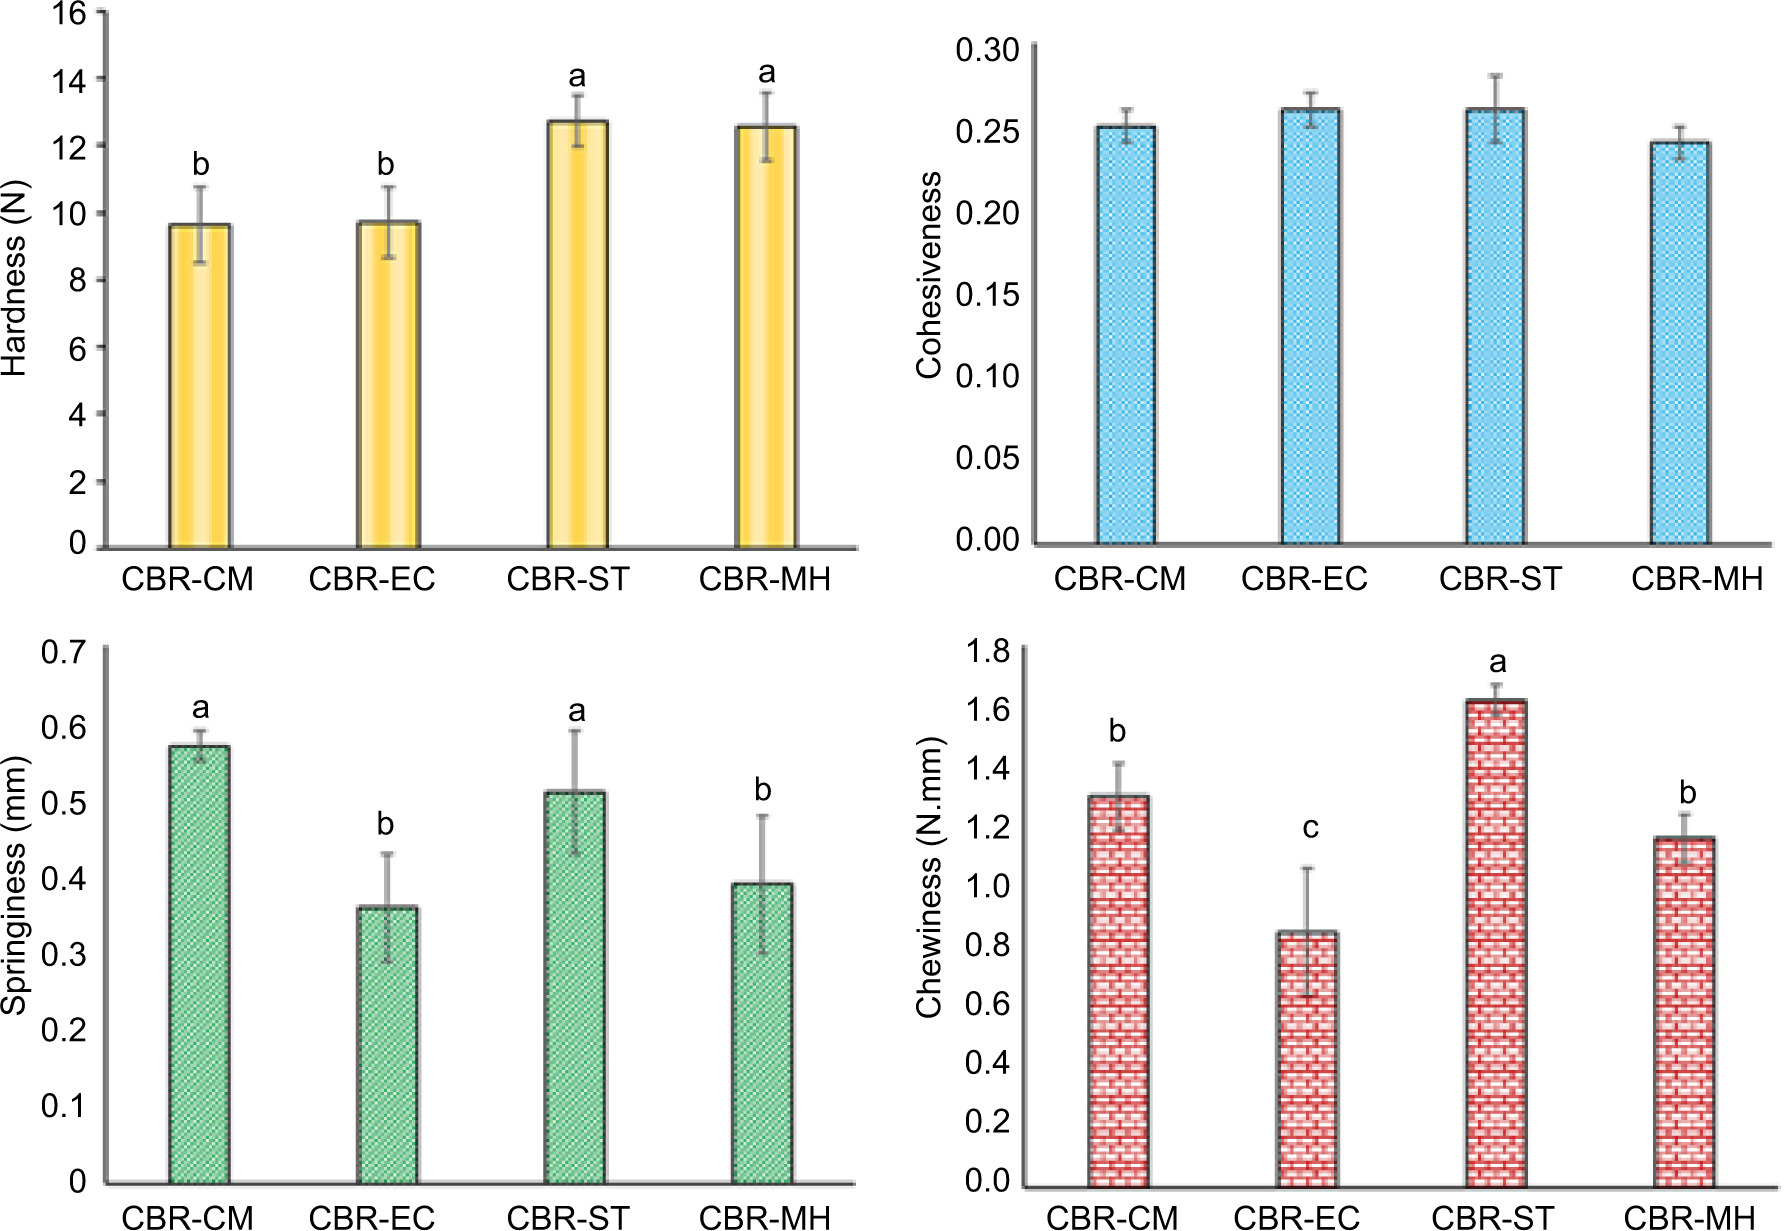
The texture characteristics in terms of hardness, cohesiveness, springiness, and chewiness of CBR produced with different methods are shown in Figure 4. It was found that cooking methods affected significantly (p < 0.05) hardness, springiness, and chewiness of cooked brown rice samples. However, no significant difference (p ≥ 0.05) in cohesiveness between cooking methods was obtained. Among the cooking methods, CBR-ST (12.73 N) and CBR-MH (12.56 N) showed a higher hardness than that of CBR-EC (9.71 N) and CBR-CM (9.36 N), respectively. This is because using less water from brown rice cooked by the steaming method decreased the DG (see the results earlier), resulting in making the cooked rice harder than CBR-EC and CBR-CM. Similarly, the highest value of chewiness (1.62 N.mm) was also observed in CBR-ST, whereas CBR-EC had the lowest value (0.85 N.mm). This is also because the rice starch matrix was hardened by the steaming process, which reduced the amount of rice starch released during the gelatinization process and produced partially gelatinized cooked rice. These results were similar to that observed by Chapagai et al. (2017), which pointed out that using high heat treatment decreased cooking time, but it also produced unsatisfactory texture and eating quality. Moreover, the degree of hydration and the water-binding capacity of the starch particles reduced the hardness and improved the textural characteristics of rice (Yao et al., 2023).
Figure 4. Texture profiles of low-amylose brown rice cooked with different methods. CBR-EC = cooked low-amylose brown rice using an electric cooker; CBR-CM = cooked low-amylose brown rice using the conventional method; CBR-ST = cooked low-amylose brown rice using the steaming treatment; CBR-MH = cooked low-amylose brown rice using microwave heating. Each observation is the mean ± SD of replicate experiments (n=3). The same small letter above each column indicates there is no significant difference between cooking methods (p < 0.05). The vertical bars on each column indicate the standard deviation.
Effect of cooking methods on morphological properties
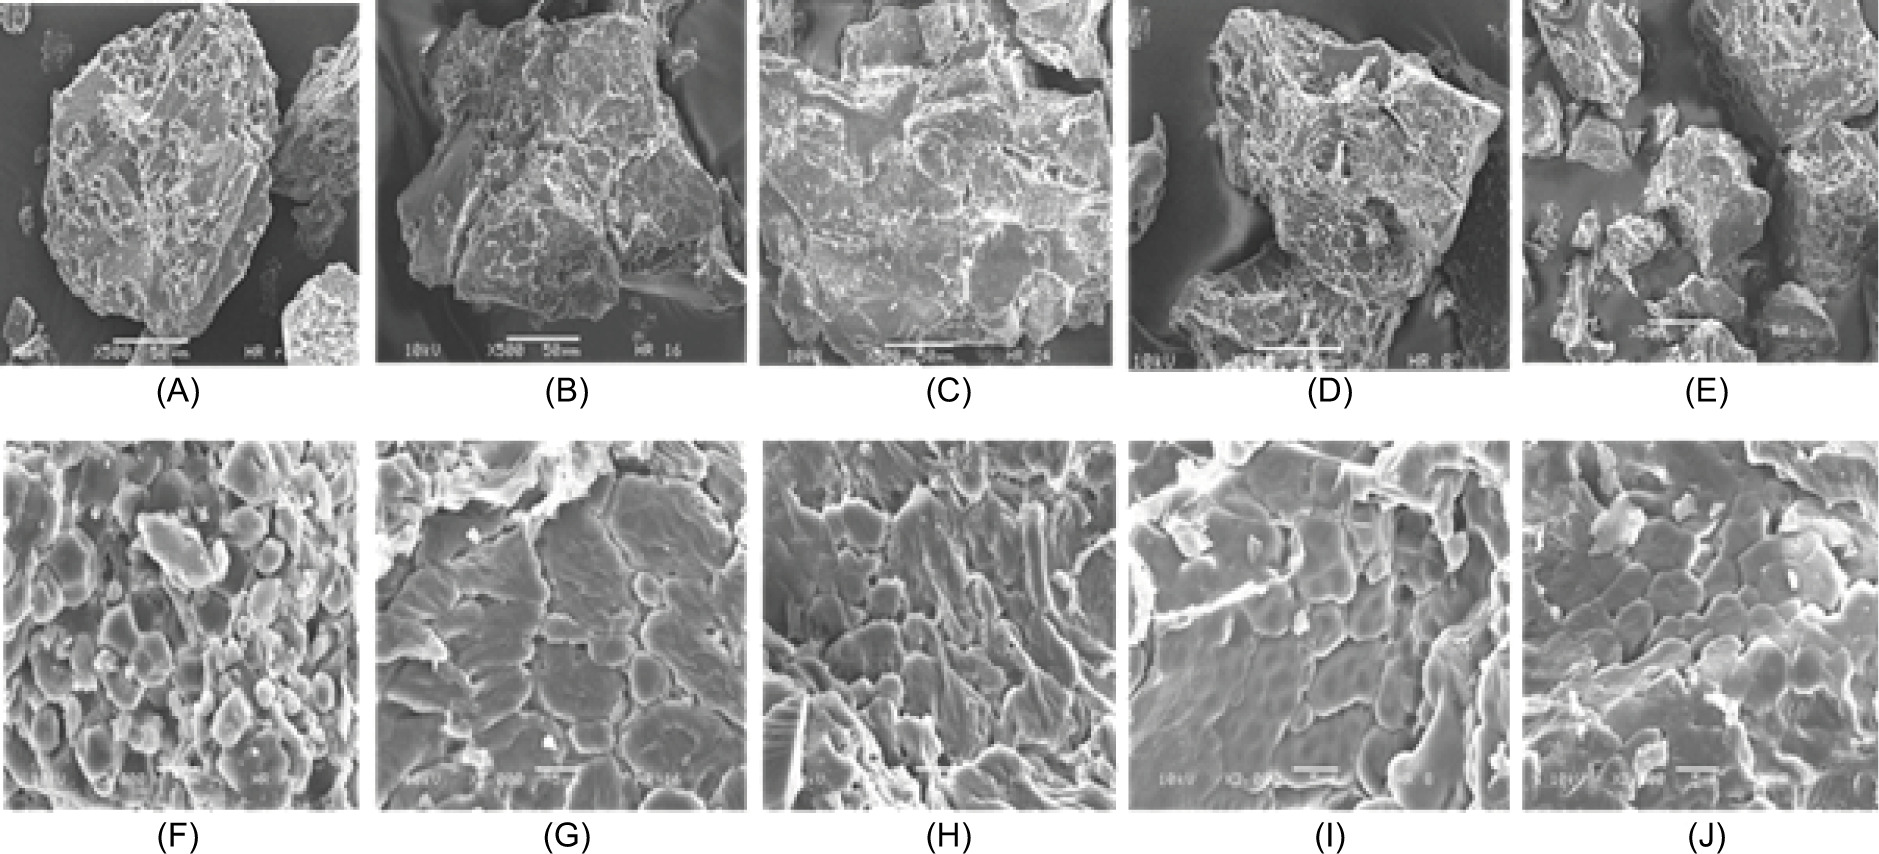
Figure 5 shows the SEM images of UBR and CBR starch granules obtained by different procedures. The structural and textural transformations of brown rice induced by cooking methods are closely tied to its GI. SEM revealed distinct morphological differences between UCBR and CBR prepared using various methods. Compared to the densely packed, smooth starch granules in UCBR, all cooked samples exhibited rougher surfaces and larger granule sizes, suggesting partial or full gelatinization. The disruption of cell membranes during cooking alters starch granule integrity, increasing surface area and hydrophilicity, which in turn affects enzymatic susceptibility and digestion rate (Yao et al., 2023). Notably, CBR-ST and CBR-MH produced rice with less gelatinized starch structures, contributing to harder textures and more compact matrices, as evidenced by higher hardness and chewiness values compared to CBR-EC and CBR-CM. Textural properties such as increased hardness and chewiness are often associated with reduced SD, as the less swollen granules limit enzyme accessibility. This is consistent with observed reductions in DG and GI for steamed samples. The microstructural resistance to gelatinization during steaming may hinder the release of rapidly digestible starch, promoting the retention of RS fractions. Thus, cooking-induced modifications in starch microstructure directly impact textural characteristics and enzymatic hydrolysis, providing a mechanistic explanation for the lower GI observed in brown rice cooked by steaming. These findings highlight the critical interplay between cooking methods, microstructural integrity, texture, and metabolic response, offering valuable insights for dietary strategies aimed at glycemic control.
Figure 5. Scanning electron microscope (SEM) micrograph of uncooked and cooked low-amylose brown rice samples taken at 500× (A–E) and 3000× (F–J) using various cooking methods. A and F = raw or uncooked low-amylose brown rice; B and G = cooked low-amylose brown rice cooked using an electric cooker; C and H = cooked low-amylose brown rice using the -conventional method; D and I = cooked low-amylose brown rice using the steaming treatment; and E and J = cooked low--amylose brown rice using microwave heating.
Correlation coefficient between physicochemical variables and eGI
The correlation analysis revealed several key relationships between different factors and the digestion and eGIs of CBR (Table 5). Protein did not show significant correlations with SL, hardness, or DG. In addition, it displayed a negative but nonsignificant correlation with both the HI and eGI (r = −0.414). SL exhibited a strong negative correlation with hardness (r = −0.756), meaning that softer rice releases more starch. It was also strongly positively correlated with gelatinization (r = 0.781), suggesting that increased SL enhances DG. Furthermore, SL demonstrated significant positive correlations with HI (r = 0.759) and eGI (r = 0.760), indicating that higher SL contributes to greater digestion and glycemic response. Hardness showed a moderate negative correlation with DG (r = −0.521), implying that firmer rice has a lower DG. In addition, it had a strong negative correlation with both HI (r = −0.751) and eGI (r = −0.751), reinforcing the idea that harder rice is less digestible and has a lower glycemic impact. The DG was strongly positively correlated with HI (r = 0.796) and eGI (r = 0.797), suggesting that greater gelatinization enhances digestibility and glycemic response. Finally, eGI and HI showed a strong correlation (r = 1.000), indicating that increased starch hydrolysis directly leads to a higher GI. These findings align with previous studies, indicating that fat and hardness play crucial roles in reducing SD and glycemic response (Frei et al., 2003; Zhou et al., 2007). The strong correlation between SL, DG, and GI response suggests that cooking methods that promote SL, such as boiling, may increase the GI impact of brown rice. Furthermore, the negative relationship between hardness and the GI supports the idea that firmer rice, which resists enzymatic digestion, results in lower glycemic responses (Ranawana et al., 2009). This study highlighted the significant influence of SL and DG on the glycemic response of CBR.
This study has some limitations. First, the eGI values were derived from an in vitro digestion model, which may not fully reflect in vivo postprandial responses. Second, although cooked rice samples were digested within 60 min after preparation, some degree of early starch retrogradation may still occur and could slightly influence digestibility outcomes. Third, the study focused on freshly cooked rice and did not include a 24-h cooled or stored treatment, which would provide additional insight into retrogradation-induced changes in the starch structure. Finally, the experiments were conducted using a single low-amylose brown rice cultivar; therefore, the findings may not be generalizable across rice types with different amylose contents or grain structures.
Conclusions
This study provides novel and comprehensive insights into how rice-to-water ratios and cooking methods influence the physicochemical, nutritional, and glycemic properties of low-amylose brown rice. The 1:2 rice-to-water ratio substantially lowered SD and produced the lowest eGI values; however, this reduction in digestibility was accompanied by noticeably lower sensory acceptance compared with the 1:3 ratio. In contrast, the 1:3 ratio offered the most balanced outcome, yielding fully cooked grains with superior texture and flavor scores while maintaining moderate digestibility. Among the cooking methods evaluated, steaming was most effective in minimizing DG, SD, and eGI without compromising textural firmness or essential nutritional attributes. This investigation focused specifically on low-amylose aromatic brown rice—a grain increasingly favored for its soft texture and aroma but rarely studied in the context of functional food development. The integration of SEM and instrumental texture analysis further contributes to the novelty of this work by revealing mechanistic links between microstructural changes and SD. Moreover, the finding that microwave cooking retains higher ash content and supports moderate gelatinization adds a new dimension to the understanding of how modern appliances can be leveraged to optimize nutrient retention alongside glycemic control. These findings have practical applications for developing health-oriented cooking practices and rice-based products. They provide guidance for consumers aiming to manage postprandial glucose, support food scientists in formulating low-GI foods, and inform dietary recommendations. Overall, this study identifies strategies such as steaming with a 1:3 water ratio as an effective approach to align cooking practices with nutritional goals and public health objectives, promoting whole-grain consumption, and reducing the risk of diet-related metabolic disorders. Future research should validate the GI of brown rice through in vivo studies, since the current eGI values were obtained using an in vitro model, to ensure accurate dietary recommendations.
Statements and Declarations
The authors declare that they have no known competing financial interests or personal relationships that could have appeared to influence the work reported in this paper.
Acknowledgments
This research project was financially supported by Mahasarakham University.
Data Availability Statement
The data that support the findings of this study are available from the corresponding author upon reasonable request.
Mandatory Disclosure on Use of Artificial Intelligence
ChatGPT was initially employed to correct the English grammar. The text was then revised by a native English language editor. The authors take full responsibility for the content of the publication.
Author Contributions
A. Moongngarm: Funded the acquisition, methodology, conceptualization, supervision, project administration, writing- original draft, review, and manuscript editing. N. Jorralee: Methodology, experiment, investigation, formal analysis, data curation. P. Loypimai: Methodology, conceptualization, supervision, writing – original draft, and manuscript editing.
Conflicts of Interest
The authors declare no conflict of interest.
Funding
This research project was financially supported by Mahasarakham University.
REFERENCES
AOAC. 2000. Official methods of analysis (16th ed.). Association of Official Analytical Chemists.
Atkinson, F.S., Foster-Powell, K., Brand-Miller, J.C. 2008. International tables of glycemic index and glycemic load values. Diabetes Care, 31(12): 2281–2283. 10.2337/dc08-1239
Bett-Garber, K.L., Champagne, E.T., Ingram, D.A., & McClung, A.M. 2007. Influence of water-to-rice ratio on cooked rice flavor and texture. Cereal Chem. 84(6): 614–619. 10.1094/CCHEM-84-6-0614
Birch, G.G., Priestley, R.J. 1973. Degree of gelatinisation of cooked rice. Starch/Stärke, 25: 98–100.
Boers, H.M., Seijen Ten Hoorn, J., Mela, D.J. 2015. A systematic review of the influence of rice characteristics and processing methods on postprandial glycaemic and insulinaemic responses. Br. J. Nutr. 114(7): 1035–1045. 10.1017/S0007114515001841
Chapagai, M.K., Rosli, W.D., Manan, W.N., Jalil, R.A., Karrila, T.T., Pinkaew, S. 2017. Effect of domestic cooking methods on physicochemical, nutritional and sensory properties of different varieties of brown rice from Southern Thailand and Malaysia. Int. Food Res. J. 24(3): 1140–1147.
Cheng, Z., Qiao, D., Zhao, S., Zhang, B., Lin, Q., Xie, F. 2022. Whole grain rice: Updated understanding of starch digestibility and the regulation of glucose and lipid metabolism. Compr. Rev. Food Sci. Food Saf. 21(4): 3244–3273. 10.1111/1541-4337.12985
Chin, L., Therdthai, N., Ratphitagsanti, W. 2020. Effect of microwave cooking on quality of riceberry rice (Oryza sativa L.). J. Food Qual. 2020: 4350274. 10.1155/2020/4350274
Chinachanta, K., Shutsrirung, A., Herrmann, L., Lesueur, D., Pathomaree, W. 2021. Enhancement of the aroma compound 2-acetyl-1-pyrroline in Thai jasmine rice (Oryza sativa L.) by rhizobacteria under salt stress. Biology. 10(10): 1065. 10.3390/biology10101065
Deepa, G., Singh, V., Naidu, K.A. 2008. Nutrient composition and physicochemical properties of Indian medicinal rice—Njavara. Food Chem. 106(1): 165–171. 10.1016/j.-foodchem.2007.05.062
Denardin, C.C., Walter, M., da Silva, L.P., Souto, G.D., Fagundes, C.A.A. 2007. Effect of amylose content of rice varieties on glycemic metabolism and biological responses in rats. Food Chem. 105(4): 1474–1479. 10.1016/j.foodchem.2007.05.028
de Souza Batista, C., Pozzada dos Santos, J., Lambrecht Dittgen, C., Colussi, R., Zaczuk Bassinello, P., Elias, M.C., Vanier, N.L. 2019. Impact of cooking temperature on the quality of quick cooking brown rice. Food Chem. 294: 125260. 10.1016/j.foodchem.2019.125260
Ershidat, O.T.M., Elsebaie, E.M., Badr, M.R. 2024. Impact of using plasma activated water in pan bread preparation on dough-rheological characteristics and quality properties. J. Cereal Sci. 118: 103983. 10.1016/j.jcs.2024.103983
Fardet, A. 2010. New hypotheses for the health-protective-mechanisms of whole-grain cereals: What is beyond fibre? Nutr. Res. Rev. 23(1): 65–134. 10.1017/S0954422410000041
Frei, M., Siddhuraju, P., Becker, K. 2003. Studies on the in vitro starch digestibility and the glycemic index of six different-indigenous rice cultivars from the Philippines. Food Chem. 83(3): 395–402.
Goni, I., Alonso, A.G., Calixto, F.S. 1997. A starch hydrolysis-procedure to estimate glycemic index. Nutr. Res. 17(3): 427–437.
Goni, I., Gracia-Diz, L., Manas, E., Saura-Calixto, F. 1996. Analysis of resistant starch: A method for foods and food products. Food Chem. 56: 333–337.
Han, S.H., Lee, S.W., Rhee, C. 2008. Effects of cooking methods on starch hydrolysis kinetics and digestion-resistant fractions of rice and soybean. Eur. Food Res. Technol. 227: 1315–1321. 10.1007/s00217-008-0846-6
Heiniö, R.L., Noort, M.W.J., Katina, K., Alam, S.A., Sozer, N., de Kock, H.L., Hersleth, M., Poutanen, K. (2016). Sensory characteristics of wholegrain and bran-rich cereal foods—A review. Trends Food Sci. Technol. 47: 25–38. 10.1016/j.tifs.2015.11.002
Juliano, B.O. 1993. Rice in human nutrition (FAO Food and Nutrition Series No. 26). Food and Agriculture Organization of the United Nations.
Jung, E.Y., Suh, H.J., Hong, W.S., Kim, D.G., Hong, Y.H., Hong, I.S., Chang, U.J. 2009. Uncooked rice of relatively low gelatinization degree resulted in lower metabolic glucose and insulin responses compared with cooked rice in female college students. Nutr. Res. 29(7): 457–461. 10.1016/j.nutres.2009.07.002
Kaur, P., Kaur, H., Aggarwal, R., Bains, K., Mahal, A.K., Gupta, O. P., Singla, L.D., Singh, K. 2023. Effect of cooking and storage temperature on resistant starch in commonly consumed Indian wheat products and its effect upon blood glucose level. Front. Nutr. 10: 1284487. 10.3389/fnut.2023.1284487
Kim, M.J., Oh, S.G., Chung, H.J. 2017. Impact of heat--moisture treatment applied to brown rice flour on the quality and digestibility characteristics of Korean rice cake. Food Sci. Biotechnol. 26(6): 1579–1586. 10.1007/s10068-017-0151-x
Kong, F., & Singh, R.P. 2008. Disintegration of solid foods in human stomach. J. Food Sci. 73(5): R67–R80. 10.1111/j.1750-3841.2008.00766.x
Kozuka, C., Yabiku, K., Takayama, C., Matsushita, M., Shimabukuro, M., Masuzaki, H. 2013. Natural food-science-based novel approach toward prevention and treatment of obesity and type 2 diabetes: Recent studies on brown rice and γ-oryzanol. Obes. Res. Clin. Pract. 7(3): 165–172. 10.1016/j.orcp.2013.02.003
Lee, S., Lee, J. 2005. Effect of various processing methods on the physical properties of cooked rice and on in vitro starch hydrolysis and blood glucose response in rats. Starch/Stärke. 57(11): 531–539. 10.1002/star.200400371
Li, H., Gidley, M.J., Dhital, S. 2019. High-amylose starches to bridge the “fiber gap”: Development, structure, and nutritional functionality. Compr. Rev. Food Sci. Food Saf. 18(2): 362–379. 10.1111/1541-4337.12416
Li, Y., Su, X., Shi, F., Wang, L., Chen, Z. 2017. High-temperature air-fluidization-induced changes in the starch texture, rheological properties, and digestibility of germinated brown rice. Starch/Stärke. 69(9–10): 1600328. 10.1002/star.201600328
Liu, H., Zhu, J., Gao, R., Ding, L., Yang, Y., Zhao, W., Cui, X., Lu, W., Wang, J., Li, Y. 2024. Estimating effects of whole grain consumption on type 2 diabetes, colorectal cancer and cardiovascular disease: a burden of proof study. Nutr. J. 23(1): 49. 10.1186/s12937-024-00957-x
Loan, L.T.K., Vinh, B.T., Tai, N.V. 2024. Varieties and cooking-conditions difference in quality of instant brown rice. Food Res. 8(5): 341–347. 10.26656/fr.2017.8(5).288
Lu, Z., Wei, Y., Tang, S., Xiao, L., Wang, M. 2015. Effect of washing and cooking on nutritional quality of brown rice. Int. J. Food Sci. Nutr. 66(7): 797–803. 10.1080/09637486.2015.1056417
Mahadevamma, M., Tharanathan, R.N. 2007. Processed rice starches—present status and future directions: A review. Starch/Stärke. 59(5): 227–235. 10.1002/star.200600625
Ohtsubo, K., Suzuki, K., Yasui, Y., Kasumi, T. 2005. Bio-functional components in the processed pre-germinated brown rice by a twin-screw extruder. J. Food Compos. Anal. 18(4): 303–316. 10.1016/j.jfca.2004.10.003
Patindol, J.A., Guraya, H.S., Champagne, E.T., Chen, M.H., McClung, A.M. 2010. Relationship of cooked-rice nutritionally important starch fractions with other physicochemical properties. Starch/Stärke. 62(5): 246–256. 10.1002/star.200900260
Photinam, R., Moongngarm, A. 2023. Effect of adding vegetable oils to starches from different botanical origins on physicochemical and digestive properties and amylose-lipid complex formation. J. Food Sci. Technol., 60(1), 393–403. 10.1007/s13197-022-05626-7
Ranawana, D.V., Henry, C.J., Lightowler, H.J., Wang, D. 2009. Glycemic index of some commercially available rice and rice products in Great Britain. Int. J. Food Sci. Nutr. 60(4): 99–110. 10.1080/09637480802516191
Saleh, M.I., Meullenet, J.-F., Toker, T., Akash, M. 2017. Water to rice ratio and cooked rice texture’s liking—Internal preference-mapping approach. Qual. Assur. Saf. Crops Foods. 9(4): 291–297. 10.3920/QAS2016.1025
Sangwongchai, W., Tananuwong, K., Krusong, K., Thitisaksakul, M. 2021. Yield, grain quality, and starch physicochemical properties of 2 elite Thai rice cultivars grown under varying production systems and soil characteristics. Foods. 10(11): 2601. 10.3390/foods10112601
Sapwarobol, S., Saphyakhajorn, W., Astina, J. 2021. Biological functions and activities of rice bran as a functional ingredient: A review. Nutr. Metab. Insights. 14. 10.1177/11786388211058559
Shahbandeh, M. 2019. Total global rice consumption 2008-2019. Statista. https://www.statista.com/statistics/255977/total-global-rice-consumption/
Singh, N., Kaur, L., McCarthy, O.J., Singh, J. 2006. Relationship of starch structure to quality of rice. Starch/Stärke. 58(9): 475–490. 10.1002/star.200500538
Srisawas, W., & Jindal, V.K. 2007. Sensory evaluation of cooked rice in relation to water-to-rice ratio and-physicochemical properties. J. Texture Stud. 38(1): 21–41. 10.1111/j.1745-4603.2007.00084.x
Vîrlan, A., Coșciug, L., Țurcanu, D., Siminiuc, R. 2024. The influence of rice types and boiling time on glycemic index: An in vivo evaluation using the ISO 2010 method. Foods. 14(1): 12. 10.3390/foods14010012
Wang, H., Ding, J., Xiao, N., Liu, X., Zhang, Y., Zhang, H. 2020. Insights into the hierarchical structure and digestibility of starch in heat-moisture treated adlay seeds. Food Chem. 318, 126489. 10.1016/j.foodchem.2020.126489
Wang, H., Zhang, B., Chen, L., Li, X. 2016. Understanding the structure and digestibility of heat-moisture treated starch. Int. J. Biol. Macromol. 88: 1–8. 10.1016/j.ijbiomac.2016.03.046
Wani, A.A., Tirtawijaya, J., Hosahalli, S., Tolpadi, A.M., Anbarasu, S. 2012. Rice starch diversity: Effects on structural, morphological, thermal, and physicochemical properties. Compr. Rev. Food Sci. Food Saf. 11(3): 417–433. 10.1111/j.1541-4337.2012.00193.x
Williams, P.C., Kuzina, F.D., Hlynka, I. 1970. A rapid colorimetric procedure for estimating the amylose content of starches and flours. Cereal Chem., 47: 411–420.
Yan, X., McClements, D.J., Luo, S., Liu, C., Ye, J. 2024. Recent advances in the impact of gelatinization degree on starch: Structure, properties and applications. Carbohydr Polym. 340 : 122273. 10.1016/j.carbpol.2024.122273
Yao, F., Li, C., Li, J., Chang, G., Wang, Y., Campardelli, R., Perego, P., Cai, C. 2023. Effects of different cooking methods on glycemic index, physicochemical indexes, and digestive characteristics of two kinds of rice. Processes. 11(7): 2167. 10.3390/pr11072167
Yu, Y., Ge, L., Zhu, S., Zhan, Y., & Zhang, Q. 2015. Effect of presoaking high hydrostatic pressure on the cooking properties of brown rice. Int. J. Food Sci. Technol. 52(12): 7904–7913. 10.1007/s13197-015-1901-5
Zhang, Y., Li, F., Huang, K., Li, S., Cao, H., Xie, J., Guan, X. 2023. Structural changes of starch under different milling degrees affect the cooking and textural properties of rice. Food Chem. X(17): 100627. 10.1016/j.fochx.2023.100627
Zhou, Z., Robards, K., Helliwell, S., Blanchard, C.L. 2007. Effect of storage temperature on cooking behaviour of rice. Food Chem. 105(2): 491–497. 10.1016/j.foodchem.2007.04.005
Zhu, F. 2015. Composition, structure, physicochemical properties, and modifications of cereal starches: A review. Crit. Rev. Food Sci. Nutr. 55(4): 438–458. 10.1080/10408398.2011.650748