
Download
PAPER
Improved detection of beer-spoilage bacteria: validation of the NBB-C®-enrichment method
Giovanni De Francesco1,2, Elio Moretti2, Elisabetta Bravi 1,2*, Simona Floridi2, Ombretta Marconi1,2
1Department of Agricultural, Food and Environmental Sciences, University of Perugia, Perugia, Italy;
2Italian Brewing Research Centre (CERB), University of Perugia, Perugia, Italy
Abstract
Beer spoilage is mainly caused by a limited group of bacteria, including Levilactobacillus brevis, Fructilactobacillus lindneri, and Pediococcus damnosus. Detection is essential for beer quality control. Among the microbiological tools used by breweries, enrichment in Nutrient Media for Beer-Spoiling Bacteria (NBB-C®) is based on European Brewery Convention analytical procedures, EBC ANALYTICA analytical methods; however, in our accredited method (MI LMB 01-2021), the standard 14-day incubation is modified to 7 days to provide faster results suitable for routine brewery monitoring. This study aimed to validate the modified EBC ANALYTICA 4.3.1.4 Enrichment, 2011 method using NBB-C® media by determining its probability of detection (POD) and limit of detection using pasteurized lager beer as a test matrix. For the first time, POD curves with 95% confidence intervals were estimated for L. brevis, F. lindneri, and P. damnosus. The results provided an objective and quantitative performance evaluation of the modified NBB-C®-enrichment procedure, supporting its suitability for International Organization for Standardization/International Electrotechnical Commission (ISO/IEC) 17025-compliant testing in brewing laboratories.
Key words: beer microbiology, beer-spoilage bacteria, LOD, POD, validation
*Corresponding Author: Elisabetta Bravi, Department of Agricultural, Food and Environmental Sciences, University of Perugia, 06121 Perugia, Italy. Email: elisabetta.bravi@unipg.it
Academic Editor: Prof. Aldo Todaro, University of Catania, Italy
Received: 21 October 2025; Accepted: 22 March 2026: Published: 18 April 2026
© 2026 Codon Publications
This is an Open Access article distributed under the terms of the Creative Commons Attribution-NonCommercial-ShareAlike 4.0 International (CC BY-NC-SA 4.0). License (http://creativecommons.org/licenses/by-nc-sa/4.0/)
Introduction
A method deemed suitable for its intended purpose is normally authenticated by a process known as method validation. This is a crucial process that ensures the reliability and accuracy of all analytical methods, particularly those used for detecting and quantifying microorganisms. The International Organization for Standardization/International Electrotechnical Commission (ISO/IEC) (2017) 17025 declares in clause 7.2.2.1 that a laboratory shall validate non-standard methods, laboratory-developed methods, and standard methods used outside their intended scope or otherwise modified. Method validation is the process by which a laboratory establishes, through exhaustive studies, that the performance characteristics of the developed method fulfill the specific requirements for certain uses and provide objective evidence. Moreover, the validation process confirms, by examining and providing objective evidence, that the requisites are adequate for the intended use (Magnusson and Örnemark, 2024). According to the ISO/IEC (2017) 17025, the procedures used for the validation can be one of the listed or a combination of them: (a) calibration or evaluation of bias and precision using reference standards or reference materials; (b) assessment of the factors influencing the result; (c) testing method robustness through variation of controlled parameters; (d) comparison of results achieved with other validated methods; (e) interlaboratory comparisons; and (f) evaluation of measurement uncertainty of results.
In general, according to Magnusson and Örnemark (2014), the method performance characteristics to fulfill are (i) specificity, (ii) linearity range, (iii) accuracy (trueness and precision), (iv) detection and quantitation limit, and (v) robustness (Duygu, 2017).
Microbial testing methods include isolation, enumeration, detection, or identification of microorganisms and/or their metabolites as well as the assessment of the presence or absence of growth in materials and media. These methods can be categorized as either qualitative or quantitative. Qualitative microbiological measurement methods are those in which the measurement results are either 0 (negative result: microorganism of the defined type not detected) or 1 (positive result: microorganism of the defined type detected) (Wilrich and Wilrich, 2009).
These methods demonstrate the presence or absence of the target microorganism, directly or indirectly, in a specified quantity of test material.
Qualitative microbiological test methods should be validated by determining sensitivity, specificity, false--positive, and false-negative proportions, selectivity, matrix effect, and detection limit (Iijima et al., 2007).
Quantitative methods, on the other hand, identify the number of microorganisms available through direct enumeration (colony-forming units/CFU) or indirectly (most probable number counts, color absorbance, and impedance) in a standard quantity of material (Duygu, 2017).
For quantitative methods, the following parameters should be considered and quantitatively determined: sensitivity, specificity, false positive and false negative proportions, selectivity, efficiency, repeatability, interlaboratory reproducibility, counting uncertainty, and the limit of determination. Moreover, the matrix effect should be verified by analyzing different types of samples (Magnusson and Tsimillis, 2023).
Wide beer’s proper characteristics, such as the CO2 (approximately 5 g/L), the alcohol (approximately 4.5– 5.5% v/v), and the hop (roughly 1–4 g/L) content, restrict the growth of microorganisms. However, several bacterial species, particularly those belonging to the cluster of lactic acid bacteria (LAB), have developed adaptations that allow them to grow in this inhospitable environment (Back, 2009; Iijima et al., 2007; Schneiderbanger et al., 2018).
Lactobacillus spp. are the most common beer-spoilage bacteria, regardless of beer type (Thelen et al., 2006), especially Lactobacillus brevis (L. brevis). In 2020, a new taxonomy was introduced for L. brevis, Levilactobacillus brevis, with the etymology: bre’vis. L. adj. brevis short. Basonym: Lactobacillus brevis. Strains of L. brevis are widely found in vegetable and cereal fermentations as well as in beer-spoilage organisms; they also have been isolated from insects (Zheng et al., 2020). L. brevis is the bacterium most commonly found in beer (50% of cases) (Back et al., 1992; Vaughan et al., 2005). This obligated heterofermentative bacterium is generally tolerant of hops and grows optimally at 30°C and a pH of 4–5 (Priest, 2006). L. brevis is physiologically versatile and can cause various problems in beer, such as super attenuation, because of its ability to ferment starch and dextrins, haze formation, and acidification (Back, 2005).
Moreover, Pediococcus damnosus (P. damnosus) is a frequently encountered species that exhibits strong beer-spoilage ability (Back, 2005; Hill, 2015; Iijima et al., 2007).
Beer spoilage caused by P. damnosus is characterized by acid formation and a buttery off-flavor resulting from the development of diacetyl (Back, 2005). The amount of diacetyl produced by P. damnosus is high and often noticeable, even with a minimum level of contamination. Moreover, some strains of P. damnosus produce exopolysaccharides, making beer ropy and gelatinous. P. damnosus, commonly present as a contaminant in pitching yeast and beer, is not found in brewing raw materials, suggesting that this species is particularly well adapted to the brewing environment (Back, 2005; Sakamoto and Konings, 2003).
P. damnosus grows at a rather low temperature, and its optimum temperature range is around 22–25°C. Therefore, the incubation temperature of laboratory detection media used in quality control (QC) tests should be kept relatively low (typically 25–28°C) to comprehensively detect beer-spoilage LAB species, including P. damnosus and Fructilactobacillus lindneri (F. lindneri) (Hill, 2015). Furthermore, it is known that P. damnosus spp. preferentially grows in relatively CO2-rich environments and is almost exclusively isolated from beer and wine production environments (Back, 2005).
In addition, Lactobacillus lindneri (L. lindneri) is a common beer-spoilage bacterium. In 2020, a new taxonomy was introduced for L. lindneri: F. lindneri (lind’ne. ri. N.L. gen. n. lindneri of Lindner, identifying the German bacteriologist Lindner), and basonym: L. lindneri (Zheng et al., 2020). L. brevis was found more often in the top-fermented beers because it can grow in more acidic conditions of a higher hop and alcohol content (Rodríguez-Saavedra et al., 2020).
F. lindneri is highly resistant to hop compounds and grows optimally at 19–23°C (Back, 2005; Michel et al., 2020).
It is also reported that F. lindneri is unable to grow at temperatures >28°C. Nonetheless, this species is known to tolerate relatively high thermal treatment (up to 15 pasteurization units) and sometimes to survive suboptimal pasteurization processes (Back et al., 1992). Furthermore, F. lindneri grows poorly on many laboratory detection media used in the brewing industry, and it often causes spoilage incidents without being detected by microbiological QC tests (Storgårds and Suihko, 1998; Suzuki et al., 2008). F. lindneri causes a relatively faint haze and sediment with few off-flavour formations in beer (Back, 2005). The occurrence outside brewing environments has rarely been reported for this species, although it is suggested that a LAB species closely related to F. lindneri was isolated from wine grapes and wine-making processes (Back, 2005; Suzuki, 2011).
An overview of 2010–2016 shows L. brevis as the most frequently occurring beer spoiler, followed by Lactobacillus (para-) casei and Lactobacillus backii. However, there are fluctuations between the individual years. For example, F. lindneri, an obligatory beer spoiler, was not identified in 2013, whereas it was found in >10% contamination in 2010 (Schneiderbanger et al., 2018).
In a typical quality assurance program, samples are collected and analyzed from several QC points across the process for beer-spoilage microbes. Samples collected from these QC points are analyzed by the traditional plate-count method. This method involves taking an aliquot of a sample, spreading it on an agar plate, or filtering it, and placing the filter on an agar plate. In either case, the plates are incubated for 5–7 days and then examined for colony development and enumeration.
Plating has the advantage of being able to detect a single bacterium in the sample volume and providing quantitative results in CFU/volume (Pringle, 2020).
Enrichment media of the NBB® series, including NBB-C® (Nutrient Media for Beer-Spoiling Bacteria), are widely used in breweries and in brewing microbiology laboratories, as they are recommended by industry standards and have long been applied for the detection of beer-spoilage bacteria (Jespersen and Jakobsen, 1996).
The enrichment procedure used in this study is based on the EBC ANALYTICA 4.3.1.4 Enrichment, 2011 and 4.2.4.2 Lactobacillus and Pediococcus, 2011. In our accredited method (MI LMB 01-2021), the incubation time prescribed by EBC ANALYTICA has been modified from 14 days to 7 days to provide a faster and operationally feasible workflow, and this modification was therefore subjected to full validation in accordance with ISO/IEC (2017) 17025. In some brewery hygiene-monitoring protocols, microbiological incubation period ranging from 2 to 7 days is reported (Back, 2005; Priest, 2003); this contextualizes the relevance of validating a shorter incubation period for routine brewery applications.
The enrichment approach offers a clear advantage, as it enables the testing of 190 mL of beer. Membrane filtration is not feasible with unfiltered or bottle-conditioned beers, limiting analysis to a less-representative 1-mL subsample. Although these studies have significantly contributed to the field, no previous work has systemically estimated the probability of detection (POD) curves with 95% confidence intervals (95% CI) for major beer--spoilage bacteria. The determination of limit of detection (LOD) and POD values, together with the validation of the NBB-C®-enrichment method, was carried out for the first time in the brewing field.
Some available polymerase chain reaction (PCR) systems claim to detect 1–10 CFU/mL. Although it is theoretically possible to detect a microbial cell with PCR, the LOD is higher because of the efficiency related to the method (Pringle, 2020).
This study aimed to validate the modified NBB-C®-enrichment method (7-day incubation) by determining its POD and LOD for three major beer-spoilage bacteria using pasteurized lager beer as a test matrix. The modification of the incubation time, introduced in our accredited method (MI LMB 01-2021), was validated to ensure that the reduced duration maintains adequate detection performance. The plate count procedure with EBC ANALYTICA 4.2.4.2 Enrichment, 2011 was used solely to determine the actual inoculum levels required for POD/LOD modelling. Overall, this validation provides quantitative evidence of method performance in accordance with ISO/IEC (2017) 17025 requirements for qualitative microbiological tests.
Materials and Methods
Validation procedure and validation parameter
In this validation study, three typical beer--spoilage microorganisms were used as representatives of the target group. According to the Eurachem Guide for Accreditation of Microbiological Laboratories (Magnusson and Tsimillis, 2023) and ISO/IEC (2017) 17025 (in particular clauses 5.4.5, 5.4.6, and 5.10), the number of microorganisms included in a validation study may be limited, provided that they are representative of the intended scope and that the study design adequately evaluates the method’s performance.
For each microorganism tested, seven qualitative enrichments, at three different contamination levels (0.01, 0.26, and 2.00 CFU/mL for L. brevis and P. damnosus; and 0.02, 0.08, and 0.19 CFU/mL for L. lindneri) were performed.
The POD function and LOD were calculated according to the model presented by Wilrich and Wilrich (2009). POD function p(d) is the functional relationship between the probability p of obtaining a measurement result = 1 and the contamination of the test material, quantitatively expressed as the CFU of the microorganism of the defined type per unit of weight or volume, d (CFU/g or CFU/mL).
The validation parameters tested during the validation process were LOD and limit of quantitation (LOQ), which are the minimum number of organisms that are identified and counted. LOD is the contamination level (dp) expressed as CFU/mL (or CFU/g), where the tested method is positive with a specified probability (e.g., p = 50% or p = 95%). The p(d) and dp values are evaluated based on an intralaboratory or interlaboratory experiment; however, this validation study was conducted with intralaboratory experiments, also following the Eurachem Guide for Accreditation of Microbiological Laboratories prescription (Magnusson and Tsimillis, 2023).
In an interlaboratory experiment, the laboratory uses samples of different matrices. For each matrix i, at least three levels should be included in the experiment, that is, low, medium, and high contamination. It is assumed that for each contamination level j, the contamination dij (CFU/g or CFU/mL) of the test material is known with negligible error, either because the test material has been spiked or its contamination has been determined by a colony count (Wilrich and Wilrich, 2009). For a particular matrix i, the value fi = ln Fi, or its estimate fI = ln Fi describes the deviation of the POD curve from the ideal POD curve.
In our case, a pasteurized lager beer was used as a single matrix.
Selection of microorganisms
The microorganisms used for the validation tests are F. lindneri (DSM 20692), L. brevis (DSM 1268), and P. damnosus (DSM 20289); these are reference strains from the Deutsche Sammlung von Mikroorganismen und Zellkulturen (DSMZ, 2025) collection, originally isolated from beer or spoiled beer, and are widely recognized in brewing microbiology research. These three microorganisms were chosen because they were among the most common beer-spoilage microorganisms (Back et al., 1992; Schneiderbanger et al., 2018; Thelen et al., 2006; Vaughan et al., 2005).
Beer preparation
Pasteurized lager beer purchased from the market was used to accomplish validation tests. The analytical parameters of the beer (original extract 11.8 °Plato, alcohol by volume 5.2%, and bitterness 24 International Bitterness Units [IBU]) were determined in our laboratory using accredited EBC ANALYTICA methods: 9.4 Original, Real and Apparent Extract and Original Gravity of Beer, 2004, 9.2.1 Alcohol in Beer by Distillation, 2008, 9.43.2 Specific Gravity of Beer using a Density Meter, 2004, and 9.8 Bitterness of Beer (IM), 2020 (IM, international method).
Three target-spoilage microorganisms were added to the beer. The microorganisms were rehydrated according to the instructions reported by the DSMZ (2025) protocol for opening and revitalizing freeze-dried cultures. Briefly, each ampoule was opened under sterile conditions, rehydrated with a sterile buffer solution, gently mixed to dissolve the pellet, and transferred into pasteurized beer. Three different dilution levels of each microorganism were prepared.
Microbiological analysis
The enrichment in NBB-C® was accomplished under sterile conditions, following the method EBC ANALYTICA 4.2.4.2 Lactobacillus and Pediococcus, 2011 and 4.3.1.4 Enrichment, 2011. In all, 10 mL of NBB-C® was added to sterile 200-mL bottles (Back, 2005), which were then filled with beer up to the bottle’s capacity (≈190 mL) and sealed with a mechanical cap. For each level, seven independent enrichments were performed, in accordance with the statistical requirements of the POD/LOD approach recommended by Magnusson and Tsimillis (2023). The bottles were then incubated for 7 days at 27°C. The results were reported as growth (POS) or not detected (N.D.) by visual examination (haze formation). Observations were also made through microscopic examinations.
To verify the actual inoculum levels, each contamination level was also analyzed using the traditional plate count method described in EBC ANALYTICA 4.2.4.2 Lactobacillus and Pediococcus, 2011.
Each level was analyzed using the plate count method. In all, 100 mL of beer was filtered (0.45 µm, cellulose nitrate) with vacuum assistance and incubated anaerobically for 7 days at 27°C in NBB-A® media (Döhler). In addition, the reference beer was analyzed with the same method (with a negative result).
Results and Discussion
Table 1 shows the detection results for L. brevis (DSM 1268) at various levels of inoculum. At an inoculum level of 0.01 CFU/mL, no positive results were observed after 7 days of incubation. This indicates that at such low concentrations, L. brevis was not detected. However, positive results were observed in all cases at an inoculum level of 2.00 CFU/mL and in four out of seven cases at an inoculum level of 0.26 CFU/mL. This non-detection at the lowest concentration (0.01 CFU/mL) is a critical finding, underscoring the method’s detection limit for L. brevis within the 7-day incubation period. The transition from no detection to partial detection (at 0.26 CFU/mL) and then full detection (at 2.00 CFU/mL) clearly illustrates the dose–response relationship of the method. Four out of seven positive results at 0.26 CFU/mL further emphasized that this concentration was close to the method’s practical detection threshold, where variability in detection probability was more pronounced. These findings aligned with similar studies that reported the difficulty of detecting L. brevis at very low concentrations, particularly when using shorter incubation periods (Liu et al., 2018; Matoulková and Kubizniaková, 2015; Riedl et al., 2019). In contrast, higher concentrations yield more consistent detection. While 7 days of incubation was confirmed as sufficient in this study (as discussed in Conclusions), the challenge of detecting L. brevis at extremely low levels remains a common issue across various methods (enrichment, plate count, and PCR) because of its physiological characteristics and potential stress responses in beer (Pringle, 2020; Taskila et al., 2011).
Table 1 Results of the detection test for different levels of L. brevis.
| Inoculation level, d, (CFU/mL) | No. of tests | |
|---|---|---|
| Inoculated (nij) | Positive (yij) | |
| 2.00 | 7 | 7 |
| 0.26 | 7 | 4 |
| 0.01 | 7 | 0 |
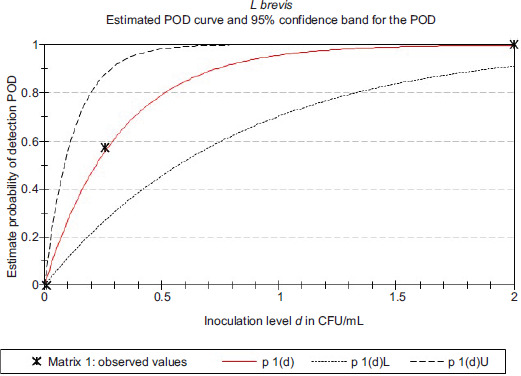
The POD curve harmonizes the statistical concepts and parameters between quantitative and qualitative method validation. POD characterizes the method’s response concerning concentration as a continuous variable. The POD model is a useful and immediate tool for the graphical representation of response curves for qualitative methods. Figures 1–3 show the estimated POD curves and 95% confidence bands for L. brevis, F. lindneri, and P. damnosus. The observed POD curve for L. brevis (Figure 1) graphically confirms this trend, showing a steep increase in detection probability as the inoculation level develops from 0.01 to 0.5 CFU/mL, before plateauing at higher concentrations.
Figure 1 The probability of detection (POD) curve and 95% variation of L. brevis.
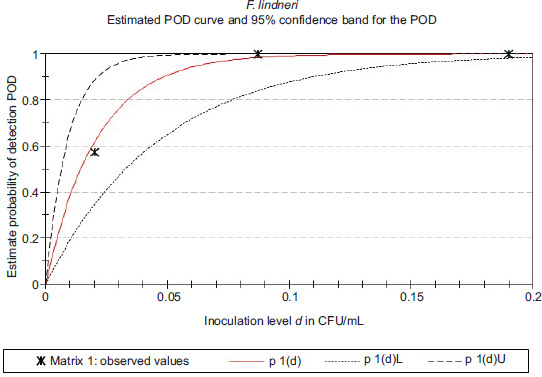
Figure 2 The probability of detection (POD) curve and 95% variation of F. lindneri.
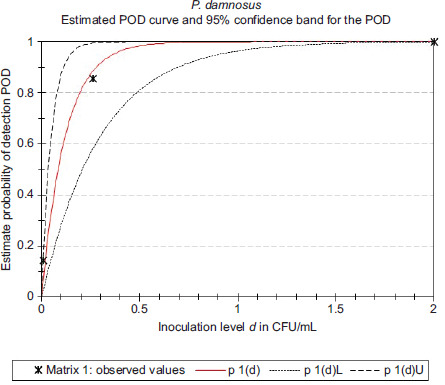
Figure 3 The probability of detection (POD) curve and 95% variation of P. damnosus.
Table 2 provides results of statistical analysis for determining LOD for L. brevis. The 95% LOD level (this is the concentration at which 95% of the tests are expected as positive) was calculated as 0.954 CFU/mL, meaning the method can detect L. brevis with 95% confidence at this concentration. This value is supported by the lower and upper confidence limits, ranging from 0.369 to 2.467 CFU/mL. Compared to previous studies, which reported detection limits for beer-spoilage LAB close to 1 CFU/mL under comparable enrichment or molecular conditions (Taskila et al., 2011), our 95% LOD level of 0.954 CFU/mL demonstrates comparable sensitivity and reliability. The calculated 95% LOD level of 0.954 CFU/mL (Table 2) indicates that, for L. brevis, a concentration of approximately 1 CFU/mL is required to ensure detection in 95% of cases using this enrichment method. The relatively wide confidence interval (0.369–2.467 CFU/mL) reflects the inherent variability associated with detecting microorganisms at low concentrations and highlights the importance of multiple replicates for robust validation. This LOD value, being within the reported range of 0.5–1.2 CFU/mL from other studies, confirms the method’s competitive performance. This consistency is particularly important because L. brevis frequently occurs as a beer spoiler, accounting for up to 50% of contamination.
Table 2 Results of the statistical analysis for detecting L. brevis.
Table 3 shows the measurement results for F. lindneri (DSM 20692). At an inoculation level of 0.19 CFU/mL, all seven tests were positive, indicating a high detection rate at this concentration. Similarly, at an inoculation level of 0.08 CFU/mL, all seven tests were positive, demonstrating the method’s continued effectiveness at lower concentrations (Wilrich and Wilrich, 2009). However, at an inoculation level of 0.02 CFU/mL, only four out of seven tests were positive, suggesting that the detection rate decreases with decrease in the concentration of microorganisms. The high detection rate for F. lindneri at 0.19 CFU/mL and 0.08 CFU/mL (all seven tests positive, Table 3) is noteworthy, especially considering that F. -lindneri is often reported as difficult to detect in conventional laboratory media or by some methods. The partial detection at 0.02 CFU/mL (four out of seven positive) marks the approximate threshold where the method’s sensitivity begins to decline. This observation is in line with the expected behavior of qualitative methods near their detection limit. These findings are consistent with those of other studies in which F. lindneri was similarly detected at low concentrations with high efficiency. The excellent detection results, particularly at concentrations of <0.1 CFU/mL, suggest that the NBB-C®-enrichment method is highly effective for F. lindneri. This contradicts the reported difficulty of detecting this species by some authors and could be attributed to the specific enrichment conditions of NBB-C® that favor its growth and recovery despite its sensitivity to higher temperatures or poor growth in many laboratory media. Figure 2 visually confirms this high sensitivity, with the POD curve rising sharply even at very low inoculation levels, approaching 100% detection rapidly.
Table 3 Results of the detection test for different levels of F. lindneri.
| Inoculation level, d(CFU/mL) |
No. of tests | |
|---|---|---|
| Inoculated (nij) | Positive (yij) | |
| 0.19 | 7 | 7 |
| 0.08 | 7 | 7 |
| 0.02 | 7 | 4 |
Table 4 shows the results of F. lindneri detection tests at various levels. The 95% LOD level was 0.063 CFU/mL. The table also presents the statistical analysis for F. lindneri with a 95% LOD level of 0.063 CFU/mL. This indicates that the method is highly sensitive and can detect F. lindneri with 95% confidence at this concentration (Wilrich and Wilrich, 2009). The 95% LOD confidence intervals range from 0.028 to 0.142 CFU/mL, suggesting a relatively narrow uncertainty range. Compared to other studies, which report 95% LOD values ranging from 0.05 to 0.08 CFU/mL, our method demonstrates superior sensitivity. The calculated 95% LOD level for F. lindneri is 0.063 CFU/mL (Table 4), with a narrow CI of 0.028–0.142 CFU/mL. This low LOD value signifies that the method is highly sensitive for F. lindneri, capable of reliably detecting very low levels of contamination. This performance is particularly impressive as it dwells below the reported 95% LOD range of 0.05–0.08 CFU/mL in other studies. This affirms the superior sensitivity achieved with this specific enrichment method. Given F. lindneri’s high resistance to hop compounds and its ability to survive suboptimal pasteurization, a highly sensitive detection method is crucial for QC in brewing.
Table 4 Results of the statistical analysis for detecting F. lindneri.
Tables 5 and 6 highlight the validation results of the method for P. damnosus (DSM 20289) beer-spoilage bacteria. When the inoculation level was 0.01 CFU/mL, positivity was determined in one out of seven cases. 95% LOD level was 0.361 CFU/mL. The results for P. damnosus (Table 5) show a pattern similar to L. brevis regarding detection at low concentrations. The detection of only one out of seven tests at 0.01 CFU/mL highlights the challenge of reliably detecting this microorganism at very low levels. However, the method demonstrates robust performance at higher concentrations, with six out of seven positive results at 0.26 CFU/mL and all seven positives at 2.00 CFU/mL (Wilrich and Wilrich, 2009). This indicates that while detection at trace levels could be variable, the method was highly effective once a certain contamination threshold was reached.
Table 5 Results of the detection test for different levels of P. damnosus.
| Inoculation level, d (CFU/mL) | No. of tests | |
|---|---|---|
| Inoculated (nij) | Positive (yij) | |
| 2.00 | 7 | 7 |
| 0.26 | 7 | 6 |
| 0.01 | 7 | 1 |
Table 6 Results of the statistical analysis for detecting P. damnosus.
Table 5 shows the results for P. damnosus. At an inoculum level of 0.01 CFU/mL, positivity was observed in one out of seven cases, suggesting limited detection at this low concentration. However, positive results were observed in all cases at a higher inoculum level of 2.00 CFU/mL and in six out of seven cases at a level of 0.26 CFU/mL, demonstrating the method’s good sensitivity at higher concentrations. Similar studies also report difficulty in detecting P. damnosus at very low concentrations but good sensitivity at higher levels. This behavior is consistent with the known characteristics of P. damnosus, which can be present as a contaminant in pitching yeast and beer, and whose optimal growth temperature is around 22−25°C, which could affect its detection kinetics in enrichment media incubated at 27°C. The POD curve in Figure 3 visually depicts this, showing a gradual increase in detection probability from very low concentrations, reaching a high probability at concentrations above approximately 0.5 CFU/mL (Wilrich and Wilrich, 2009).
Table 6 shows the results of statistical analysis for P. damnosus, with a 95% LOD level of 0.361 CFU/mL. This indicates that the method can detect P. damnosus with 95% confidence at this concentration. Confidence intervals for the 95% LOD range of 0.145–0.899 CFU/mL indicate a wider uncertainty range compared to F. lindneri. Compared to other studies, which report 95% LOD values for P. damnosus ranging from 0.3 to 0.5 CFU/mL, our findings were consistent and demonstrated reliable sensitivity. The 95% LOD level for P. damnosus was determined as 0.361 CFU/mL (Table 6), with a confidence interval of 0.145–0.899 CFU/mL. This LOD was within the expected range (0.3–0.5 CFU/mL) reported in the literature for P. damnosus, confirming the method’s reliability. A wider confidence interval compared to F. lindneri suggests slightly more variability in detection at the limit for P. damnosus. Despite this, the method’s ability to detect consistently P. damnosus, a potent beer spoiler known for diacetyl production and potential ropiness, at concentrations <0.5 CFU/mL, is critical for effective QC.
Application of validated method
The validated method was used in the Brewing Analytes Proficiency Scheme (BAPS), which is provided by LGC AXIO (LGC, Middlesex, UK) and is accredited to ISO/IEC 17043. This proficiency test (PT) is repeated annually. The BAPS microbiological program focuses on microorganisms relevant to the brewing industry, including both spoilage and non-spoilage organisms. The PT samples are provided in a lyophilized format to ensure sample integrity and are rehydrated before analysis. Enrichment assays utilizing NBB-C® medium were conducted to evaluate the growth response across a range of contaminant and non-contaminant microorganisms. Notably, application of the validated method within the BAPS PT scheme provided by LGC AXIO serves as a crucial external validation of its robustness and accuracy. As summarized in Table 7, the perfect agreement observed across 30 tests, with an equal number of low- and high-concentration samples, demonstrates the method’s high reliability in detecting relevant brewing microorganisms, encompassing both spoilage and non-spoilage organisms. This consistency with an accredited external PT confirms the method’s suitability for routine QC in brewing environments, providing strong objective -evidence of its performance.
Table 7 Results of the BAPS proficiency testing (LGC AXIO, UK).
| Analysis level | Organism type | Correct ID | Test results |
|---|---|---|---|
| R190 low | Bacteria anaerobic | Bacteria, bacteria acid-lactic, leuconostoc | POS |
| R190 high | Yeast | Yeast, brewing yeast, brewing lager | N.D. |
| R194 low | Bacteria anaerobic | Pediococcus spp. | POS |
| R194 high | Wild yeast | Rhodotorula mucilaginosa | N.D. |
| R198 low | Wild yeast | Saccharomyces cerevisiae var. diastaticus | N.D. |
| R198 high | Bacteria anaerobic | Obesumbacterium proteus | N.D. |
| R202 low | Wild yeast | Pediococcus species and Pichia anomala | N.D. |
| R202 high | Bacteria anaerobic | Levilactobacillus brevis | POS |
| R206 low | Bacteria aerobic | Bacteria, Bacillus spp. | N.D. |
| R206 high | Wild yeast | Yeast wild saccharomyces | N.D. |
| R212 low | Bacteria anaerobic | Leuconostoc mesenteroides | POS |
| R212 high | Yeast | Saccharomyces cerevisiae | N.D. |
| R218 low | Bacteria anaerobic | Levilactobacillus brevis | POS |
| R218 high | Yeast | Saccharomyces cerevisiae | N.D. |
| R224 low | Yeast | Saccharomyces cerevisiae (ale yeast) | N.D. |
| R224 high | Bacteria aerobic | Bacillus subtilis | N.D. |
| R232 low | Yeast or wild yeast | Saccharomyces pastorianus | N.D. |
| R232 high | Bacteria anaerobic | Leuconostoc mesenteroides | POS |
| R244 low | Bacteria anaerobic | Pediococcus species | POS |
| R244 high | Bacteria anaerobic | Pichia anomala | N.D. |
| R256 low | Yeast | Saccharomyces cerevisiae (ale yeast) | N.D. |
| R256 high | Bacteria anaerobic | Leuconostoc mesenteroides | POS |
| R326 low | Yeast or wild yeast | Saccharomyces cerevisiae var. diastaticus | N.D. |
| R326 high | Bacteria aerobic | Bacillus subtilis | N.D. |
| R338 low | Yeast or wild yeast | Wickerhamo mycesanomalus/Pichia anomala | N.D. |
| R338 high | Bacteria anaerobic | Leuconostoc mesenteroides | POS |
| R356 low | Bacteria anaerobic | Leuconostoc mesenteroides | POS |
| R356 high | Yeast o wild yeast | Saccharomyces cerevisiae var. diastaticus | N.D. |
| R347 low | Bacteria aerobic/anaerobic | Bacillus spizizenii / Bacillus subtilis | POS |
| R347 high | Yeast o wild yeast | Saccharomyces cerevisiae var. diastaticus | N.D. |
Notes: N.D.: not detected; POS: positive growth.
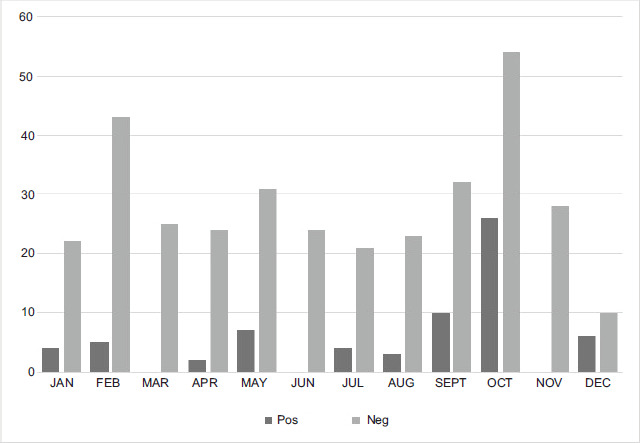
The results were reported as growth (POS) or not detected (N.D.). Furthermore, Figure 4 illustrates the application frequency of the validated method in 2024. As the graph shows, the method was applied for 404 times, achieving a positive result rate of 16.6%. Figure 4 provides a practical overview of the method’s real-world utility and the prevalence of microbiological issues in the brewing process over 2024. The total of 404 applications signifies its frequent use as a routine QC tool. The observed 16.6% positive result rate indicates that the beer-spoilage microorganisms were detected in approximately one-sixth of the analyzed samples. This highlights the continuous challenge of microbial contamination in brewing, and underscores the necessity of a reliable and sensitive detection method such as the one validated here to monitor and ensure product quality. The monthly distribution of positive and negative results could potentially offer insights into seasonal variations or specific operational periods with higher contamination risks, further reinforcing the value of continuous monitoring.
Figure 4 Frequency of the application of validated method in 2024.
Conclusions
This is the first study to establish LOD of the NBB-C® enrichment method for three major beer-spoilage bacteria in a standard lager beer. This provides brewery laboratories with a fit-for-purpose and practical benchmark for routine QC.
For the first time, the estimated POD curves and 95% confidence bands are determined for L. brevis, F. lindneri, and P. damnosus. The validation successfully demonstrates that the NBB-C®-enrichment method, according to EBC ANALYTICA 4.2.4.2 Lactobacillus and Pediococcus, 2011 and 4.3.1.4 Enrichment, 2011, exhibits a low LOD for these primary beer-spoilage bacteria. This confirms the method’s capability to reliably detect these critical microorganisms even at very low CFU/mL values, which is crucial for early detection in QC. Excellent results are obtained in the detection of F. lindneri, despite some authors indicating that it is difficult to detect using this method (Sakamoto and Konings, 2003).
Reducing the incubation time from 14 to 7 days, in line with EBC ANALYTICA 4.3.1.4 Enrichment, 2011, does not affect growth of the tested microorganisms. They are able to develop fully within the shortened timeframe. This improvement shows that accurate results can be obtained more quickly. This shortened incubation period is particularly beneficial for breweries, enabling them to bring products to market more quickly, significantly improving operational efficiency, agility, and the overall supply chain management.
In addition, the reduced-incubation enrichment time offers a major practical advantage: it can be applied to beer during maturation stages in which membrane filtration is not feasible due to turbidity and the presence of yeast.
The validated method is also applied during the BAPS PT focusing on microorganisms relevant to the brewing industry. The results obtained from 30 tests, 15 at high concentration and 15 at low concentration, are in perfect agreement with the PT results, confirming the method’s reliability.
In future, it will be interesting to test other types of spoilage bacteria as well as different types of beer, such as low--alcohol and alcohol-free beers, and beers characterized by a high quantity of hops or an elevated level of ethanol.
Mandatory Disclosure on Use of Artificial Intelligence
During the preparation of this work, the author(s) used Artificial Intelligence (AI) tools solely to improve the language, phrasing, and formatting of the manuscript. After using this service, the author(s) reviewed and edited the content as needed and take(s) full responsibility for the content of the publication.
Author Contributions
All authors contributed equally to this article.
Conflict of Interests
The authors had no relevant financial interests to disclose.
Funding
None.
REFERENCES
Back, W. 2005. Brewery. In: Back, W. (Ed.), Colour Atlas and Handbook of Beverage Biology. Fachverlag Hans Carl, Nürnberg, Germany, pp. 10–112.
Back, W. 2009. Microbiology. In: Eßlinger, H.M. (Ed.), Handbook of Brewing: Process, Technology, Markets. Wiley VCH Verlag GmbH, Weinheim, Germany, Chap. 18, p. 477.
Back, W., Leibhard, M., and Bohak I. 1992. Flash pasteurization–membrane filtration. Comparative biological safety. Brauwelt Int. 1:42.
Deutsche Sammlung von Mikroorganismen und Zellkulturen (DSMZ). 2025, July 21. Deutsche Sammlung von Mikroorganismen und Zellkulturen protocol. https://www.dsmz.de/collection/-catalogue (Accessed on: 30 Mar 26).
Duygu, D. 2017. Mikrobiyolojik test Metotlarinin Doğrulanmasi (Validasyonu). Trakya Univ J Nat Sci 2017;18(1):65-69. 10.23902/trkjnat.271725
EBC ANALYTICA. European Brewery Convention (EBC). https://brewup.eu/ebc-analytica (Accessed on: 30 Mar 26).
Eleftheriadou, M., and Tsimillis, K.C. 2023. Eurachem Guide: Accreditation for Microbiological Laboratories. Eurachem, Middlesex, UK. www.eurachem.org. (Accessed on 30 Mar 26). ISBN: 978-91-87017-92-6
Hill, A.E. 2015. Brewing Microbiology: Managing Microbes, Ensuring Quality, and Valorising Waste. Wood Head Publication, Cambridge, UK.
Iijima, K., Suzuki, K., Asano, S., Kuriyama, H., and Kitagawa, Y. 2007. Isolation and identification of-potential beer-spoilage Pediococcus inopinatus and beer--spoilage Lactobacillus backi strains carrying the horA and horC gene clusters. J Inst Brew. 113:96. 10.1002/j.2050-0416.2007.tb00262
International Organization for Standardization/International Electrotechnical Commission (ISO/IEC). 2017. ISO/IEC 17025: General Requirements for the Competence of Testing and Calibration Laboratories. ISO/IEC, Geneva, Switzerland.
International Organization for Standardization/International Electrotechnical Commission (ISO/IEC). 2016. ISO/IEC 17034: General Requirements for the Competence of Reference Material Producers. ISO/IEC, Geneva, Switzerland.
Jespersen, L., and Jakobsen, M. 1996. Specific spoilage-organisms in-breweries and laboratory media for their detection. Int J Food Microbiol. 33(1):139–155. 10.1016/0168-1605(96)01154-3
Liu, J., Deng, Y., Soteyome, T., Li, Y., Su, J., Li, L., Li B., Shirtliff, M.E., Xu, Z., and Peters, B.M. 2018. Induction and recovery of the viable but nonculturable state of hop--resistance Lactobacillus brevis. Front Microbiol. 9:2076.
Magnusson, B., and Örnemark, U. 2024. Eurachem Guide: The Fitness for Purpose of Analytical Methods – A Laboratory Guide to Method Validation and Related Topics, 3rd edn. Eurachem, Middlesex, UK. www.eurachem.org. (Accessed on: 30 Mar 26). ISBN 978-91-87461-59-0.
Magnusson, B., and Tsimillis, K.C. 2023. Accreditation for Microbiological Laboratories, 3rd edn. Eurachem, Middlesex, UK. www.eurachem.org. (Accessed on: 30 Mar 26). ISBN 978-91-519-6581-9.
Matoulková, D., and Kubizniaková, P. 2015. Microbiology of-brewing–lactic acid bacteria and cultivation methods of their detection–part I. Kvasnýprůmysl. 61:76. 10.18832/kp2015012
Michel, M., Cocuzza, S., Biendl, M., Peifer, F., Hans, S., Methner, Y., Pehl, F., Back, W., Jacob, F., and Hutzler, M. 2020. The impact of different hop compounds on the growth of selected beer spoilage bacteria in beer. J Inst Brew. 126(4):330-336. 10.1002/jib.624
Priest, F.G. 2003. Gram-positive brewery bacteria. In: Brewing Microbiology Priest, F.G., and Campbell, I. (Eds.).Springer, Boston, MA, p. 181. 10.1007/978-1-4419-9250-5_5
Priest, F.G. 2006. Microbiology and microbiological control in the brewery. In: Priest, F.G., and Stewart, G.G. (Eds.) Handbook of Brewing. CRC Press, Boca Raton, FL, 622 p. 10.1201/9781420015171-20
Pringle A.T. 2020. A brewer’s guide to applying PCR in a-quality assurance program. MBAA TQ. 57(3):190. 10.1094/TQ-57-3-1011-01
Riedl, R., Dünzer, N., Michel, M., Jacob, F., and Hutzler, M. 2019. Beer enemy number one: genetic diversity, physiology and biofilm formation of Lactobacillus brevis. J Inst Brew. 125:250. 10.1002/jib.553
Rodríguez-Saavedra, M., González de Llano, D., and -Moreno-Arribas, M.V. 2020. Beer spoilage lactic acid bacteria from craft brewery microbiota: Microbiological quality and food safety. Food Res Int. 138:109762. 10.1016/j.foodres.2020.109762
Sakamoto, K., and Konings, W.N. 2003. Beer spoilage bacteria and hop resistance. Int J Food Microbiol. 89(2–3):105. 10.1016/s0168-1605(03)00153-3
Schneiderbanger, J., Grammer, M., Jacob, F., and Hutzler, M. 2018. Statistical evaluation of beer spoilage bacteria by real-time PCR analyses from 2010 to 2016. J Inst Brew. 124(2):173. 10.1002/jib.486
Storgårds, E., and Suihko, M.L. 1998. Detection and identification of Lactobacillus lindneri from brewery environments. J Inst Brew. 104 (January–February):47–54.
Suzuki, K. 2011. 125th Anniversary review: microbiological instability of beer caused by spoilage bacteria. J Inst Brew. 117(2):131. 10.1002/j.2050-0416.2011.tb00454.x
Suzuki, K., Asano, S., Iijima, K., and Kitamoto, K. 2008. Sake and beer spoilage lactic acid bacteria–a review. J Inst Brew. 114(3):209. 10.1002/j.2050-0416.2008.tb00331.x
Taskila, S., Juuti, T., Kylä-Nikkilä, K., and Ojamo, H. (2011). Improved enrichment cultivation of beer-spoiling lactic acid bacteria by continuous glucose addition. J Inst Brew. 117(2):264–271.
Thelen, K., Beimfohr, C., and Snaidr, J. 2006. Evaluation study of the frequency of different beer-spoiling bacteria using the VIT analysis. Tech Q Master Brew Assoc Am. 43:31.
Vaughan, A., O’Sullivan, T., and Van Sinderen, D. 2005. Enhancing the microbiological stability of malt and beer–a review. J Inst Brew. 111(4):355. 10.1002/j.2050-0416.2005.tb00221.x
Wilrich, C., and Wilrich, P.T. 2009. Estimation of the POD function and the LOD of a qualitative microbiological-measurement method. J AOAC Int. 92(6):1763. 10.1093/jaoac/92.6.1763
Zheng, J., Wittouck, S., Salvetti, E., Franz, C.M.A.P., Harris, H.M.B., Mattarelli, P., O‘Toole, P.W., Pot, B., Vandamme, P., Walter, J., Watanabe, K., Wuyts, S., Felis, G.E., Gänzle, M.G., and Lebeer, S. 2020. A taxonomic note on the genus Lactobacillus: description of 23 novel genera, emended description of the genus Lactobacillus beijerinck 1901, and union of Lactobacillaceae and Leuconostocaceae. Int J Syst Evol Microbiol. 70(4):2782. 10.1099/ijsem.0.004107